March 22, 2021
Australian 2021 property outlook
Jack Green
While the economy continues to recover from COVID-19, there are a number of challenges facing real estate investors and owners in the year ahead.


Jack Green
While the economy continues to recover from COVID-19, there are a number of challenges facing real estate investors and owners in the year ahead.
The outlook for the global economy has improved substantially. While the road ahead will no doubt be turbulent, there are better prospects for a sustained recovery, albeit economic growth is largely dependent on COVID-19 vaccine rollouts being successful.
In Australia, GDP is expected to grow 3.0% in 2021 following the first recession in nearly 30 years in the middle of 2020. Positively, the recovery to date has been stronger than anticipated, with GDP now expected to return to its end-2019 level by the middle of the year.
While remote working and hobbies as an alternative to travel, in conjunction with non-discretionary spend, helped prop up the retail sector, service industries such as tourism and aviation will continue to lag.
The unemployment rate has declined to 6.4% according to the Reserve Bank of Australia (RBA), although this is still higher than most of the previous two decades. The rate is forecast to continue to decline to 6.0% by the end of 2021 and 5.5% by the end of 2022.
On 2 March 2021, the RBA announced the cash rate would remain unchanged at 0.1% until actual inflation is sustainably within the 2-3% range. Reaching this inflation target will require a significant improvement in employment and a return to a tight labour market, which the RBA does not anticipate until 2024 at the earliest. As such, the cash rate is likely to remain at an all-time low for some time yet.

While the office sector was heavily affected by COVID-19, other sectors, particularly logistics, have benefitted.
Unsurprisingly, vacancy in Australia’s CBD office markets rose throughout 2020. As at January 2021, the Australian CBD vacancy rate had risen 3.1% year-on-year to 11.1%. Sydney and Melbourne saw their year-on-year vacancy more than double to 8.6% and 8.2% respectively. Brisbane was more subdued, increasing 0.9% to 13.6%.
Despite short-term challenges and much media speculation, the office is here to stay. While landlords supported tenant-customers through the government-mandated Code of Conduct, these measures have now mostly ceased.
A preference for high-quality, technology-enabled and wellness-focused buildings will be of increasing appeal to most potential occupiers. As such, building owners must continue to overhaul workplace design and configurations, strengthen health and safety protocols, adopt smart building technology as well as generally enhance the overall tenant-customer experience. These trends were relevant pre-COVID-19, but have been accelerated over the past year.
A defining theme in 2021 may lie in these value-add opportunities. According to JLL estimates, as much as 40% of existing office stock needs some form of upkeep and investment in order to stay relevant. Consequently, investor appetite for value-add investments is likely to increase.
Although organisations have generally now returned to the office, many have adopted a hybrid model, in which employees split their time between working in the office and working remotely.
A survey conducted by CBRE across Asia Pacific found that more than 70% of managers would prefer to have office-based staff. This infers a disconnect between organisations and their employees, however, the rapid urbanisation and infrastructure improvements across CBD fringe locations have resulted in the emergence of decentralised business hubs which might be able to bridge this gap.
JLL’s ‘Future of the Office’ survey found a hub-and-spoke model might be a suitable compromise between remote working and a lengthy commute to the office. Across Asia Pacific, 31% of companies are contemplating adopting this model, with a further 30% of respondents stating the pandemic has made it less important to maintain large headquarters in CBD locations.
The shift to e-commerce has accelerated changes in shopping behaviour, pushing retailers to reconsider their sales and distribution strategies and landlords towards experiential offerings, particularly for shopping centres or malls.
Given consumers can buy almost anything, anywhere, shopping centres and the brick-and-mortar stores within them must therefore shift focus to incorporate experiential offerings, rather than the simple, traditional procedure of purchasing things.
Retail success now depends on a sound omni-channel strategy, whereby retailers use their store networks for customer acquisition, brand experience, online order fulfilment, returns and data gathering.
An unforeseen but positive outcome experienced throughout COVID-19 has been the boom to certain discretionary sectors. Hardware, home appliances, electronics and household goods have boomed, first as Australians began working from home, and then as lockdowns lifted, home improvement and hobby goods moved to the fore.
The extent of this was evidenced by JB Hi-Fi reporting a HY21 net profit after tax of $317.7 million, an 86.2% increase on HY20, with online sales up 161.7%, representing 13.7% of total sales for the half. Similarly, Super Retail Group, which owns BCF, Rebel and Supercheap Auto, reported net profit after tax up 201% to $172.8 million, with online sales up 87.3%, representing 13.3% of total first half sales.
Separately and unsurprisingly, non-discretionary retail has so far performed as strongly as anticipated throughout the pandemic, with properties substantially weighted towards grocery and other ‘essentials’ always in demand.
The logistics sector has largely benefitted from the challenges facing the retail sector, both prior to and as a result of COVID-19. The pandemic has accelerated many of the longer-term trends that have facilitated record levels of investment into the sector, such as increased internet penetration rates and the aforementioned omni-channel retailing.
Supply chain resilience will come under scrutiny as companies defend against disruption. Efficiency and evolution will drive the future of logistics assets, particularly through automation and multi-storey facilities. Logistics capital growth is shaping up to be considerably stronger than rental growth in 2021, with yields compressing further in what is a popular and increasingly overcrowded sector.
The road to recovery will have its challenges. Investors must work hard to find good investment opportunities, particularly on the back of trends that have been accelerated by COVID-19. These include assets with value-add potential in the office sector and logistics assets that will continue to benefit from a sharp uptick in e-commerce
Lockdown has been like a giant experiment, especially for the logistics sector which has had to deal with unprecedented demand with next to no lead time while adapting to new ways of working, or put another way, social distancing.
By any set of measures, the response has been impressive, providing a glimpse into the potential of a technology-enabled way of life that many had predicted was still some years away. So, what happens next?
Now that the ratchet has been forced up a notch, will life go back to normal or will the forced mass adoption of all things online, whether to order essential items like groceries or to feed people’s growing ‘Amazon habits’, have an enduring impact on the logistics sector?
The logistics sector will not be immune to COVID-19, but at the start of 2020 it was underpinned by generally solid fundamentals. Vacancy was low across most of the European market – below 7% in the Netherlands, Poland and the UK – demand was robust and overbuilding wasn’t an issue with opportunities for investors existing across the logistics spectrum, ranging from large distribution centres to urban delivery hubs in inner city areas.
Labour availability was one of the main concerns for logistics operators with the unemployment rate falling to around 6.2% across the EU by the end of 2019. While rates are expected to rise, often from historic lows, governments are implementing a range of fiscal policy measures intended to encourage businesses to retain workers and maintain consumption levels.
The logistics sector is a clear beneficiary of the rise of e-commerce over the last few years. While this is nothing new, the trend is likely to continue unabated with the COVID-19 pandemic and related social distancing measures simply accelerating the rise of online retailing. While some demand may fall away once ‘normal’ life resumes and lockdown measures are lifted, albeit gradually, this is by no means guaranteed.
COVID-19 may generate a spike in online sales for as long as the containment and social distancing measures remain in place as consumers depend more on e-commerce, but the underlying trend is one of continued expansion. The initial impact was on the grocery sector, but this is likely to spread to other consumer sectors. Indeed, we may well see an acceleration in the adoption of online retailing as many businesses turn to deliveries as a way of maintaining business continuity. The current level of online adoption among consumers may become the new ‘normal’. Retail sales are forecast to grow by approximately 2.3% a year between 2019 and 2024, according to Oxford Economics data, while online penetration is predicted to grow at an average of 8.5% a year in the same period according to Savills.
All this extra activity requires more storage space. While some space may be released back to the market as some retailers hit the wall, deliveries are here to stay. Some suppliers have started stockpiling in anticipation of increased online retail spend by consumers, and to mitigate disruption to the upstream supply chain.
In the long term, more warehouses will switch to automation and robots, which creates opportunity for value-add players to take advantage of price dislocation and build costs which have come off their peak, to reinvigorate older stock and upgrade with automation. Short term however, getting materials onsite will be problematic and construction work is being delayed as labour movement is restricted, which means a proportion of the schemes due to complete during the remainder of 2020 and into the first half of 2021 will be delayed. Some schemes may even be withdrawn as developers struggle under tighter financing conditions, all of which adds additional pressure to the tightly supplied warehouse market.
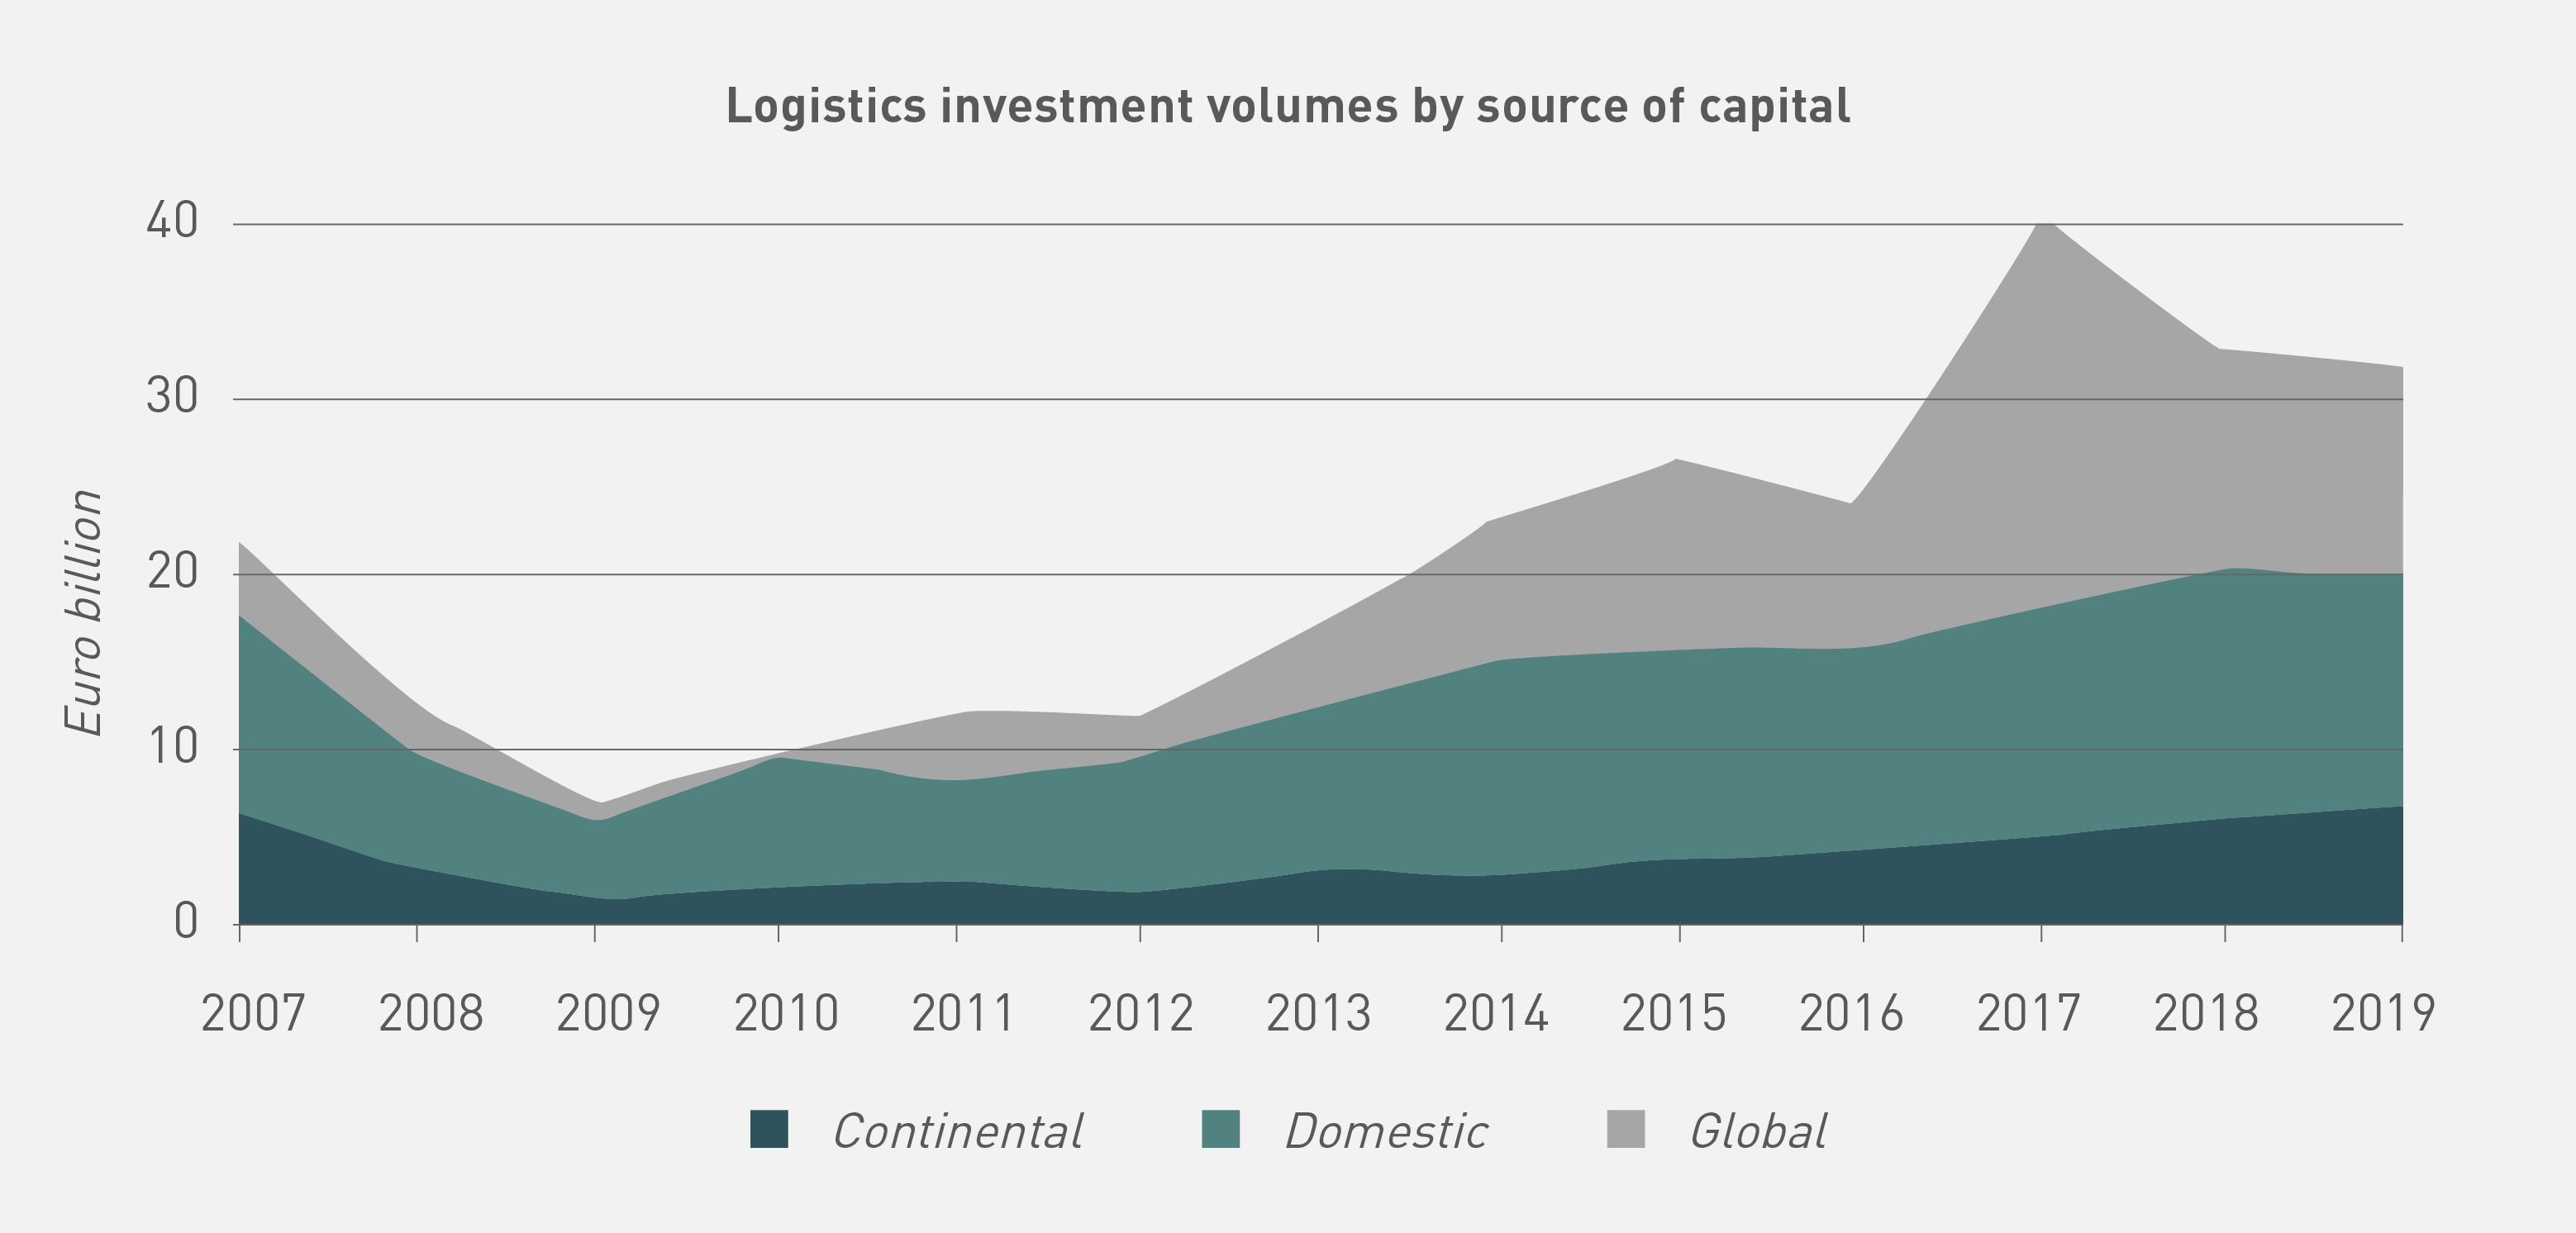
Investment volumes have been rising steadily since the last market trough in 2009, when just €6.9 billion worth of logistics transacted across Europe. In 2017, a peak year that was boosted by some large deals, trading volumes hit €40.4 billion. Interest in the sector has continued at very robust levels over the last couple of years, with €35.8 billion transacting in 2019 with the UK, France, Germany and the Netherlands consistently amongst the most active markets in Europe, also recording some of the highest penetration of online retailing.
There is, of course, the much talked about slowdown to the European economy hitting markets hard, although there has been a much swifter reaction by Central Banks than was seen during the GFC which, it is hoped, will go some way to supporting the weakening economic situation. But there are still a lot of unknowns: the main factors being the length of lockdowns, the impact of the gradual lifting of measures being seen across a number of European countries, the possible resurgence of the virus and when and how much consumer demand will be impacted, with the acceptance that a proportion will be permanently lost.
While the market drivers are there, real estate fundamentals underpinning the sector are healthy, capital is waiting on the sidelines to deploy when appropriate opportunities present themselves, the full-year 2020 trading volumes are expected to be subdued. While Q1 numbers are looking relatively healthy with €7.6 billion changing hands and above the long-term quarterly average of €6.2 billion. Activity levels are largely reflecting the conclusion of deals already in the pipeline pre-COVID-19 and a truer picture is likely to emerge as Q2 progresses. Indications thus far are for a much slower quarter as less product is openly marketed – stymied, for now at least, by the inability to view potential assets, conduct technical due diligence and the gap between buyer and seller expectations on pricing.
Once a new pricing benchmark has been established, capital is likely to react quickly, but during times of uncertainty, investors will favour core assets in strong locations. These will include assets close to infrastructure hubs as carbon emission regulations bear down and are now higher up the agenda and/or gateway cities, which service the growing demand for last-mile logistics. In addition, the wall of global capital headed to Europe is expected to ease, at least temporarily, providing a buying window for domestic institutions and cross-border European capital familiar with their local markets to take a larger share.
Matthew Cridland, a tax lawyer and Partner at K&L Gates provided an example of how build-to-rent taxes would rack up in New South Wales.
Firstly, duty applies at a premium of 7% for vacant land purchases above $3 million. If the party acquiring the land is foreign, an 8% ‘Surcharge Purchaser Duty’ also applies, lifting the total duty to 15%.
An MIT is considered a ‘foreign person’ if an overseas company holds a 20% or more interest. On a $20 million vacant residential development site, total duty costs – including premium rate and surcharges – would be $2,940,490, or 14.5%
NSW also imposes a land tax surcharge of 2% on residential land owned by a foreign person, wherein no thresholds apply. Australian-based, foreign-owned developers are exempt from these surcharges, but only if they are developing new homes or residential lots for sale. The exemptions do not apply to foreign institutional investment in new residential developments which will be held for lease – regardless of the economic benefits such projects may provide.
Beyond the aforementioned surcharges, the existing land tax rules also work against institutional investment. In NSW, a premium land tax of 2% is applied to a site with an unimproved land value above $4,231,000. As such, for build-to-rent projects, it is reasonable to anticipate the 2% tax will be applicable.
For an unimproved $20 million development site, land tax would be $372,104. Surcharges would likely increase this by $400,000 to $772,104. However, unlike duty, this is an annual expense that varies as land values fluctuate.
By this point in the example, it should come as no surprise that GST also works against the build-to-rent sector. For a build-to-rent project involving total costs of $110 million, no credit is available for the $10 million of GST. However, an identical project, differing only through the intention to sell rather than lease upon completion, would allow the developer to claim a $10 million credit and have a net cost of $100 million.
These surcharges and taxes may vary on a state level, but the impact they have, in addition to the 30% withholding tax rate, means the sector faces substantial headwinds.
COVID-19 has been a shock on both the supply and demand sides. One of the interesting questions this throws up is what occupiers are doing with their supply chains. Historically, companies have minimised supply chain inventories, keeping them flowing at low, but continuous levels, so they can remain competitive.
An additional consideration if there are ongoing shortages to disruptions in global supply chains is a potential shift to re-shoring or near sourcing, as companies bring their supply chains closer to home. This could translate into demand for more warehouse space near ports and airports, and rising demand for distribution hubs along the supply chain.
In summary, COVID-19 is expected to result in higher inventory volumes and a reassessment of business continuity plans, which will create stronger demand for warehouse space. Whatever the outcome of the COVID-19 pandemic, and despite current economic demand side pressures which has suppressed economic activity, when the risk subsides, the expectation is for a rebound in activity.
As the world adjusts to life with COVID-19, there will be many lessons learnt about the pandemic. How did we adapt? How well did we respond? What did we get right? What did we get wrong? Which systems and technology did we turn to that helped us to continue to perform life’s various tasks in a COVID world?
One thing is certain. The adoption of cloud-based IT systems enabled many to continue working remotely in a way that would have been unimaginable as little as ten years ago. The pandemic is pushing everyone to adapt to new circumstances and forcing even the most stalwart office workers to change the habits of a lifetime.
Whether remote working becomes the new normal or not is almost irrelevant. The exponential growth of data created by social media, mobile devices, video streaming and cloud computing has been with us for some time and this has driven an unprecedented demand for data and data centres. This demand has only been accelerated by COVID-19 as it pushes even more of modern life and business online.
Of course, behind every online and cloud-based technology, there is something physical – an asset sitting on a strategically-chosen plot of land somewhere in the world. These data centres are the engines that power the modern data-driven world.
With more than $100 billion invested in data centres over the past decade by a broad cross section of institutional investors including pension funds, private equity, infrastructure funds and sovereign wealth funds, the growth potential of the sector is well-established. With strong real estate asset backing and long-term leases against world class Hyperscale and Cloud operators, investors have realised data centre properties provide stable income, downside protection and strong potential upside.
The challenge investors face is how to find the right investment opportunity capable of providing these attractive returns over the long term. As much an infrastructure asset as a straight real estate investment, a thorough understanding of data centre fundamentals and demand drivers is essential.
Among these, the ability to assess the suitability of the land, where it sits in the ecosystem of data centres and the level of political and regulatory support is crucial.
For example, in Singapore, where land availability is a major constraint, multi-level facilities are being constructed, whereas in other jurisdictions proximity of a data centre site to power facilities and fibre connectivity are defining considerations.
From an environmental, social and governance (ESG) perspective, and in a world where businesses including the major cloud storage providers like Google, Microsoft and Amazon have set themselves ambitious targets to become carbon neutral by 2050, availability of renewable power sources is a major consideration.
Different jurisdictions can also offer a broad variety of incentives, particularly where competition between countries or states is high. These come predominantly in the form of sales or property tax incentives and can have significant influence on a project’s overall viability. These incentives are mainly offered in the USA, with competing states and counties courting data centre users.
Roughly speaking, latency is linked to the amount of time it takes data to travel from user to data centre and then back to user. Perhaps surprisingly, in an era of super-fast fibre communications, the physical distance of the data centre from the user or customer is a still a key factor in determining latency.
As technology advances and applications based on the Internet of Things (IoT) pervade our everyday lives, latency is one of the key considerations for end users. After all, would you trust a driverless car if you knew it was prone to glitches caused by connectivity issues and latency?
To address the latency issue, organisations have developed smaller data centres, so-called EDGE data centres, which are located closer to the end user. They typically connect to a larger primary data centres. By processing data and services as close to the end user as possible, edge computing allows organisations to reduce latency, thus enabling the adoption of services and applications linked to the IoT.
In Western Europe, most large data centres are grouped into a discontinuous corridor of urbanisation with a population of around 111 million people known as the Blue Banana. It stretches from North West England to Northern Italy, crossing a number of countries including Belgium, the Netherlands, Eastern France and Germany. Lying at the heart of this area, Belgium has the fastest connectivity.

As demand for faster connectivity grows, driven by AI and the IoT, there is an attractive opportunity to devise real estate investment strategies that plug the geographic gaps between large data centres, enabling EDGE capability in not just Western Europe but most developed countries.
As long as the right projects are selected, data centres have the potential to be great investments. For example, a speculative build would normally only start once good lease commitments had been secured and new sites should pay for themselves in a relatively short time period. Once up and running, the risk to investors can be limited with phased build outs possible and datacentres typically producing high EBITDA margins and high cash conversion.
Despite all the current uncertainty and market volatility created by COVID-19, future long-term demand for the applications that rely on datacentres appears to be not only healthy, but to have been reinforced by our COVID-19 behaviour and the enhanced adoption of systems reliant on the technology.
Ultimately, in the current climate, many organisations are looking to incorporate a more flexible and agile approach to their operations to ensure they are better able to mitigate the impact of future disruption, whatever the source. While this will be beneficial to the sector, and as is the case with all real estate investments, timing, market knowledge and experience will be key to ensuring success.
Alex Dunn, Research Manager, Cromwell Property Group
Over the last 50 years, the style of the modern office has changed considerably. Initially, offices were populated by personal cellular spaces, which encouraged both privacy and a quiet working environment with limited interaction with colleagues apart from perhaps around the coffee machine. Working patterns gradually moved away from this, with recent designs favouring an open plan environment which encourages collaboration, creativity and team-based working.
Now, further change is afoot. Cromwell has interviewed an international network of contacts on their views about the office sector, overlaid its findings with analysis of changes in recent working practices and concluded that the office space of the future will look and operate differently. This transformation is being driven by four key trends: flexibility, technology, sustainability and wellbeing.

Flexibility in today’s world means offering employees choice over when, where and how they work. As companies compete to attract and retain talent, they are having to rethink traditional approaches to work and offer employees more flexibility. The benefits of doing so include a more engaged, productive and loyal workforce with employees themselves claiming a better work-life balance, more suitable working hours, often a reduction in time spent commuting, as well as reduced stress levels and mental health benefits.
Remote working is a large component of this flexibility. A sizeable proportion of the office-based workforce no longer needs to go to an office and can largely work anywhere. This is, in part, due to technological advancements over the last 20 years, but also due to the changing nature of work itself, the rise of the ‘knowledge worker’, as well as changes to workplace culture and employee expectations.
Despite this, before COVID-19, the statistics show only a relatively small proportion of employees actually worked remotely. In 2019, only 5.4% of employees in the European Union (EU) usually worked from home according to Eurostat, and this figure has remained relatively constant over the last decade. Over the same period, the proportion of those who sometimes worked from home rose from 6% in 2009 to 9% in 2019.
The increasing number of millennials in the workforce and their expectations and desire for a generally healthier work-life balance will likely see a rise in the percentage of these workers spending more time out of the office environment, whilst working. Prior to the pandemic, in a survey of over 7,300 of its employees, JLL reported that 47% of workers under the age of 35 worked away from the office at least once a month, compared to 27% of over 35-year olds.
The importance of going to a dedicated place of work should not be underestimated however. The office remains a place where employees can gather to collaborate, feel that they are part of a team and be creative in ways that are not possible remotely. The office also provides a social element to working life and is important for creating and maintaining the culture of a company, a critical element to overall performance. It will come as no surprise that, driven by an increase in remote working due to COVID-19, more companies are examining ways to retain social cohesion and culture amongst an increasingly distributed workforce.
Companies will assess their long-term needs for office space with these structural changes in mind. With a higher proportion of staff not needing to be in the office at the same time, some businesses will take the opportunity to review their real estate portfolio.
It remains to be seen whether this means businesses will reduce requirements or potentially elect to decentralise or redistribute operations by creating mini-hubs closer to where people live. Reductions due to flexible working patterns have the potential to be offset by any unwinding of densification trends of the last 20 years as requirements increase to cater for social distancing and the myriad of spaces now needed for meetings, breakouts, collaboration and quiet work.

Improved efficiency and reduced costs have historically been the main drivers of the adoption of new building technology but other drivers are now emerging. In particular, the current uncertainty around when and to what extent traditional business travel will resume, combined with a potentially larger portion of employees working remotely has meant that businesses must rethink their traditional large conference boardroom table formats, and consider the number of personal ‘quiet’ spaces now required for the increase in virtual meetings.
In the short term, the use of video conferencing apps to facilitate remote meetings will continue and the COVID-19 crisis could accelerate the development of new technologies such as virtual reality (VR) and augmented reality (AR) in order to enhance remote meetings further and help capture some human qualities in these virtual interactions. Fitouts will also need to adopt to this new technology as it arrives and come companies have already started to experiment with VR and AR using 3D avatars which can shake hands and interact with people in a meeting room, for example.
Technology is also being deployed to building management systems (BMS) to manage all aspects of a building’s operations from HVAC systems to smart lighting and smart elevators, with occupiers also beginning to turn to sensor technology to optimise space utilisation, air quality and workplace safety and adjust settings, where necessary, to maintain the optimal working environment. The ability of technology to monitor and measure emissions and the general performance of real estate is an ongoing and increasingly important imperative.
As more tech-native generations enter the workplace the shift towards technology integration, which requires a fast and stable internet connection, will only continue. Connectivity, both fibre optic and 5G, will become increasingly important from an occupier perspective, and as new technologies are introduced will likely increase both construction and fitout costs. In the long term, smart offices will be the norm, driving both human performance and also contributing to sustainability and wellness.

Real estate accounts for approximately 36% of global energy consumption and 40% of total direct and indirect CO2 emissions, according to JLL. With the global trend towards urbanisation and the ever-increasing demand for new building stock, these numbers are only set to rise.
It’s not all bad news however as The United Nations Environment Programme (UNEP) estimates that the real estate sector has the greatest opportunity to reduce greenhouse gas emissions when compared to other industries, with potential energy savings estimated to be as much as 50% or more by 2050.
Government policies regulating the energy performance of new buildings are a powerful way of reducing emissions to meet this challenge and are being introduced by an increasing number of countries. Leading cities are also introducing city-level regulation at a fast rate. Paris, for example, has a net zero carbon goal for 2050 and Amsterdam plans on being fully electric by the same time.
The ‘Green Deal’ has also been established in order to make the EU climate neutral by 2050. The deal looks to mobilise €100 billion of investment between 2021 and 2027 and one of the key programmes includes construction sustainability and increasing the renovation rate of old buildings.
Increasing regulation, as well as social and tenant pressures, are making sustainability increasingly critical for investors in terms of office construction, renovation and fitout. For those companies wishing to stay ahead of the curve, incorporating sustainability innovations into core business and asset management strategies is the only way to ensure the buildings of today do not become rapidly obsolete tomorrow.

Historically, many offices have been classed as ‘unwell’ spaces, with business leaders generally expressing cynicism when it came to the relationship between wellbeing and employee and business performance. There is an increasing level of research, however, that suggests office environments that do not contribute to wellbeing can impair performance and are ultimately at risk of heightened vacancy levels and loss of income.
According to Cushman & Wakefield, 77% of CEOs globally see accessing and retaining skilled labour as the biggest threat to their businesses. Attracting and retaining talent is not easy, and losing it is expensive, with anywhere from 50% to 200% of a lost employee’s salary spent on recruiting and onboarding new employees, not to mention integrating them into a new culture.
Businesses are therefore increasingly investing in their office space as part of their talent ‘attraction and retention package’, attempting to lure health-conscious employees with modern office designs, fresh air, ample daylight, green walls as well as other amenity options and break-out and recreation spaces. All these efforts will support positive mental health and general levels of productivity..
The inclusion of bike storage and end-of-trip facilities has also become critical with cycling to work and opportunity for physical activity throughout the day of increasing importance to many. The future workplace will look different as employers increasingly focus on these, and other wellbeing options.
Whilst the office sector was already evolving to meet a raft of changing cultural, demographic and business demands, COVID-19 has only acted as a catalyst to the changes. An increase in flexible working in particular, will impact how and when employees use the office and force many businesses to reconsider the composition, distribution and specifications of their real estate and office working requirements.
Technology and sustainability will also combine to enable businesses to monitor, create and provide a healthier and more pleasant working environment for their employees. The office will continue to be a significant tool for employers to attract and retain talent, but it will inevitably look and operate differently as businesses continue to learn from the experience of COVID-19.
A longform version of this article has been published in The Institute of Real Estate Letter on 21 October 2020 and can be viewed on their website https://irei.com/publications/institutional-real-estate-europe.
Australia’s longstanding nickname is ‘the lucky country’, based on our prosperity and reinforced, in part, by nearly three decades of consecutive annual economic growth. However, digging slightly deeper into the ‘lucky country’ moniker suggests all is not what it seems.
Firstly, the quote. Originating from Donald Horne’s 1964 book, ‘The Lucky Country’, the entire phrase states, ‘Australia is a lucky country run mainly by second rate people who share its luck. It lives on other people’s ideas, and although its ordinary people are adaptable, most of its leaders (in all fields) so lack curiosity about the events that surround them, that they are often taken by surprise.’
Horne’s quote has long been twisted to fit a specific context. A similar argument can be made that this is also the case for Australia’s economic growth as measured by its GDP numbers.
Economic growth is typically measured in terms of gross domestic product (GDP), a measure of the value of all goods and services produced in a given country, across a given timeframe.
The equation to calculate GDP is private consumption + gross investment + government investment + government spending + (exports – imports). Each component is explained below.
A recession refers to two consecutive quarters of negative GDP growth.

Australia’s last recession ended in 1991, and since then, there have only been three individual quarters of negative GDP growth. In December 2000, as a result of the dot-com crash and recession across Europe; in December 2008, during the Global Financial Crisis; and in March 2011, due to the Queensland floods.
With the recent bushfires, subsequent flooding and impact of the Coronavirus on tourism and international students, there is a strong possibility Q1 2020 will be the fourth.
Overall, Australia has had relatively high levels of economic growth (3.3% annually) compared to other developed economies between 1992 and 2017, placing it eighth out of the 32 Organisation for Economic Cooperation and Development (OECD) nations.
The last couple of years have seen weaker GDP growth, capped with a 1.7% growth rate for the 12 months to September 2019. GDP per capita growth over this same period, however, was a much more modest 0.2%.

GDP per capita is a measure of a country’s economic output that accounts for its number of people. It simply divides the country’s GDP by its total population. Growth in GDP per capita demonstrates how much economic growth is exceeding population growth, which can be used as an indication of improvement, or decline, of living standards.
Australia recorded relatively strong growth in annual GDP per capita between 1992 and 2017, but did not outperform other OECD countries to the same extent as overall GDP. This underscores the importance of population growth, and the sometimes-controversial role of immigration in particular, in accounting for the resilience of Australia’s economy since the 1991 recession.
Effectively, where GDP is the ‘lucky country’ part of Donald Horne’s quote, GDP per capita paints a more nuanced picture.

The claim that Australia has gone almost three decades without a recession has been under fire in recent years, particularly as Australia suffered a ‘per capita recession’ to close out 2018. The September (-0.1%) and December (-0.2%) quarters saw negative GDP per capita growth.
The second half of 2018 marked the third time this had happened since Australia’s conventional recession in 1991. The September (-0.1%) and December (-0.7%) 2000 and March (-0.1%) and June (-0.2%) 2006 quarters each saw negative growth in GDP per capita.
Additionally, while there have only been three negative GDP growth quarters since 1991, there have been 20 quarters of falling GDP per capita growth.
However, it may be unfair to call consecutive quarters of negative per capita growth a recession at all, as it more closely resembles a slowdown. For example, through the 2006 ‘recession’, job growth remained solid, unemployment fell, and it occurred while Australia was in the midst of its mining boom.
Growth slowing below the level of population growth, especially with weak wages growth and high underemployment, is a concern as it effectively highlights that people are less well off than they were before. A per capita recession on its own, however, is not necessarily the same as a real recession, and the three seen over the past 28 years do not compare to the impact of the 1991 recession on jobs, confidence and economic welfare.
In 2018, 17 countries, the majority of which are emerging economies, recorded positive annual GDP growth, but negative growth in GDP per capita. Of these countries, Bahrain experienced perhaps the greatest disparity between annual growth in GDP (1.78%) and GDP per capita (-3.11%), with population growth at 4.92%.
Compare the emerging economy of Bahrain, to one of the world’s most highly-developed economies’ in Japan. In 2018, Japan’s annual GDP growth was 0.78%, a full 1% behind Bahrain. However, with an ageing population and shrinking workforce Japan’s population declined 0.2%, meaning GDP per capita was actually higher at 0.99%.
While the economic profiles of Japan and Bahrain are vastly different, the above demonstrates an increase in GDP per capita, as in Japan, does not always make it a better indicator, particularly when a country’s population is in decline.
As more major economies begin to reach peak population, as currently experienced by Japan, Russia and some of Western Europe, their GDP growth will, in turn, begin to decline unless they find ways to become substantially more productive, and do ‘more with less’.
Australia’s population is expected to grow 24% to 31.4 million by 2034, meaning over the medium term our GDP figures should continue to be propped up by this increase. However, if productivity and population growth were to decline at the same time, we might need to reconsider how we measure economic success, particularly if gross GDP numbers become consistently negative year in, year out.
It takes, on average, 2.1 children born per woman to maintain a country’s population – this is known as the replacement rate. The current global fertility rate sits at 2.44 children per woman. However, since the 1960’s, the rate has halved and is below the replacement rate in most western countries.
Presently, just under half of the world’s population live in countries with a fertility rate below the replacement rate. Because these countries are not repopulating fast enough to maintain their current population, an imbalance is emerging between the ratio of elderly dependents to working-age people. This is set to intensify over coming decades.
The United Nations predicts that by 2100, almost 30% of the population will be aged 60 or older. As life expectancy continues to increase steadily, dependents will live longer. This will have a range of economic impacts.
Healthcare costs will strain resources, while smaller working populations will struggle to produce enough income tax revenue to support these rising costs. If left unchanged, this will likely cause spending power to decrease, consumerism to decline, job production to slow, and ultimately, the global economy to stagnate.
Immigration has been a solution for many countries, particularly Australia and the United States. In 2017, Australia’s net migration figure was 263,300, which represented 1.07% of the population, while the US figure was 4,774,029, representing 1.47%.
Several nations are already experiencing the effects of an ageing population with existing elderly dependents. A quarter of Japan’s population is currently over the age of 65. With a far lower net migration rate (357,800 in 2017, representing just 0.28% of the total population), Japan is attempting to utilise R&D and technology to substantially increase productivity and offset the demographic driven slowdown of its GDP.
Build-to-rent could offer institutional investors a stable asset class and fill a substantial gap in the country’s housing stock, but tax hurdles remain an impediment to the viability of this emerging sector.
Build-to-rent refers to a residential development in which all of the units are retained by an owner or developer and leased out, as opposed to being sold off to multiple owners as per the traditional build-to-sell model. The developer owns and manages the units as long-term income generating assets, typically benefitting from economies of scale when it comes to maintenance, repairs and other general upkeep.
As Australia continues to urbanise and inner-city land values increase, owning a house can suddenly become a more distant dream for many. Confronted with this reality, there is a new generation prepared to rent for longer in order to continue to access the lifestyle, location and amenity-rich environment that they are attracted to, and that build-to-rent can provide.
For institutional investors, build-to-rent provides diversification from traditional asset classes by providing a secure revenue stream with a new and growing customer base. Institutions deploy capital into the build-to-rent sector overseas in order to diversify their portfolios and achieve a low-risk, stable, long-term income return for their investors.
Growth in the sector will be underscored by build-to-rent helping address Australia’s housing supply deficit as the population continues to grow. Unlike other commercial assets, which are generally comprised of a small number of long-term leases, build-to-rent developments are comprised of hundreds of diversely structured rental agreements that turn over on a rolling basis.
The appeal of the sector is based in long-term returns similar to aged care and hotels, which compare favourably with both equity market and commercial returns, along with providing lower volatility. As demonstrated across the US build-to-rent sector, during an economic downturn, rents are more resilient, decline less and improve more rapidly than other commercial sectors.
Similar to commercial assets, profit from a build-to-rent development is derived through rental income. High tenant turnover and long vacancy periods are therefore detrimental to income, and as a result, build-to-rent developments incorporate elements designed to attract and retain tenants.

Build-to-rent’s lack of presence across Australia can largely be attributed to a number of tax-related hurdles the sector faces.
Firstly, a managed investment trust (MIT) is a type of trust in which investors collectively invest in passive income activities, such as shares, property or fixed interest assets.
MIT’s are common structures in the commercial real estate sector. For example, an office building may be purchased by an institution, such as an industry superannuation fund, through an Australian MIT. In turn, this provides the super fund with access to a share of an income stream, such as the rent paid by tenants.
MIT’s are also popular with foreign investors, as income from this type of trust can enable a relatively low rate of tax, and tax simplicity for partial ownership of certain Australian assets.
In the case of an MIT with entirely commercial asset holdings, payments to all investors have tax withheld, generally 15%. However, the withholding tax on residential real estate, including build-to-rent MIT income for foreign investors is 30%.
Alongside the MIT withholding tax on foreign investors are additional surcharges, as well as high land tax costs for institutional investors across the board, plus high upfront GST costs. This is illustrated in the example below.
Matthew Cridland, a tax lawyer and Partner at K&L Gates provided an example of how build-to-rent taxes would rack up in New South Wales.
Firstly, duty applies at a premium of 7% for vacant land purchases above $3 million. If the party acquiring the land is foreign, an 8% ‘Surcharge Purchaser Duty’ also applies, lifting the total duty to 15%.
An MIT is considered a ‘foreign person’ if an overseas company holds a 20% or more interest. On a $20 million vacant residential development site, total duty costs – including premium rate and surcharges – would be $2,940,490, or 14.5%
NSW also imposes a land tax surcharge of 2% on residential land owned by a foreign person, wherein no thresholds apply. Australian-based, foreign-owned developers are exempt from these surcharges, but only if they are developing new homes or residential lots for sale. The exemptions do not apply to foreign institutional investment in new residential developments which will be held for lease – regardless of the economic benefits such projects may provide.
Beyond the aforementioned surcharges, the existing land tax rules also work against institutional investment. In NSW, a premium land tax of 2% is applied to a site with an unimproved land value above $4,231,000. As such, for build-to-rent projects, it is reasonable to anticipate the 2% tax will be applicable.
For an unimproved $20 million development site, land tax would be $372,104. Surcharges would likely increase this by $400,000 to $772,104. However, unlike duty, this is an annual expense that varies as land values fluctuate.
By this point in the example, it should come as no surprise that GST also works against the build-to-rent sector. For a build-to-rent project involving total costs of $110 million, no credit is available for the $10 million of GST. However, an identical project, differing only through the intention to sell rather than lease upon completion, would allow the developer to claim a $10 million credit and have a net cost of $100 million.
These surcharges and taxes may vary on a state level, but the impact they have, in addition to the 30% withholding tax rate, means the sector faces substantial headwinds.
Potential exists for a number of positive flow-on effects from a burgeoning build-to-rent sector.
Increased capital means greater stock
Overseas capital investment is vital to the success of the build-to-rent sector in Australia. In the commercial sector, foreign capital reached $11.5 billion in 2019, which was a third of all investment activity. A greater level of institutional capital will inevitably lead to more development activity and stock coming online.
Higher-density living
It is anticipated build-to-rent developments will be high-density buildings, typically exceeding 200 dwellings in inner city and well-located capital city locations.
In the UK, the average size of build-to-rent developments is growing, which indicates the confidence from investors in the sector. In Q3 2019, the average size of each development was 133 units, while projects under construction increases to 245 units, which grows again to 325 units for those in the planning phase.
Lower rents from increased competition
Hypothetically, competition amongst build-to-rent providers could create competition to attract tenants. This is the case in the commercial office space, where institutional investment has enabled the delivery of premium amenity to appeal to tenants.
Institutional investment in the residential sector could therefore create better rental conditions, such as more responsive building management, or slower rental increases.
Over a third of the US population lives in private rental accommodation, and of this, 36%, or approximately 10% of the total US population live in multi-unit rental communities. As such, the build-to-rent, or as it is known locally, ‘multi-family’ sector is large, well established and liquid.

According to the National Multi-family Housing Council, the sector is worth a total of US$3.3 trillion, with the majority of this capital provided by banks, life insurance companies, commercial mortgage-backed securities or government-backed lending programmes.
The sector also has a significant economic impact. In 2016, the most recent year comprehensive figures are available, multi-family apartment construction generated over US$150 billion in economic activity, as well as over 750,000 jobs.
In order for Australia’s build-to-rent sector to compete with some of the most successful countries globally, tax conditions must change to level the playing field for foreign investors. The most important change to facilitate the success of this emerging sector would be to reduce the MIT withholding tax to 15% across the board. Additional positives would be revised land tax and duty surcharge revenue and to level the land tax playing field for all residential investors.
The build-to-sell model has dominated the Australian residential landscape for decades, with policy based around this. However, with more people renting, cities growing rapidly and people wanting a greater choice in their housing options, it is clear there is demand for build-to-rent. It is now up to state and federal governments to ensure policy frameworks allow supply to match demand.
Hotels have long been grouped into the category of ‘specialty’ property, alongside the likes of seniors’ living, student accommodation and even data centres. However, as investors continue to look for alternatives to the mainstay real estate sectors, the hotel market has become an increasingly acceptable option for many institutional investors.
Hotels are categorised in numerous different ways, including star ratings, size of hotel and number of rooms, location, ownership and affiliation, and also the type of hotel which is aligned to its offering.
The most common types of hotel markets include business, airport, resort or leisure, casino, convention and conference hotels.

The hotel asset class possesses a number of key differences when compared to some other real estate sectors.
Owner or operator
All hotels require an operator, but whilst the operator and underlying investor (or owner) can be one and the same, particularly for boutique hotels, this is not necessarily always the case.
Many larger branded or chain hotels tend to have a mix of several ownership types including direct ownership, management contracts or franchise arrangements. For example, just because the name says Hilton, does not mean the Hilton Company owns the property.
Hotel rooms are perishable goods
A hotel room, like an airline seat, is a perishable good. That is, once a specific date occurs, every room not booked for that night perishes. Similar to airline seats, there is no market for yesterday’s rooms.
This presents a challenge as every hotel obviously wants as many rooms as possible booked each night, albeit the temptation is often to discount the room. Ongoing discounting, however, can damage a hotel’s brand and lead to other challenges.
Pricing fluctuates greatly
Hotel prices are put through a rigorous prediction process. Pricing rooms is not as simple as knowing when peak and off-peak seasons are. Rather, the hotel looks at the past year’s demand and compares it to larger trends correlating with the wider hotel industry. These include the economy of the country in which the hotel is situated, competitors’ prices for similar rooms, and even weather patterns.
A hotel will also look at its booking history. In doing so, the hotel seeks to identify the ‘booking curve’ in order to understand the optimal number of rooms that should be booked at certain intervals in advance (generally one, two and/or three months).
The overarching goal for every hotel is to ensure the most rooms are booked per night, at the highest price possible. As such, during stretches of lower demand or if actual bookings are lower than projected, room prices can be decreased to incentivise last-minute booking. On the other hand, prices are generally raised when demand is high.
Booking platforms are important
Online booking platforms have become an important tool to ensure the greatest possible number of rooms are occupied on a nightly basis, particularly when demand is low during off-peak times.
Third party agency sites such as Booking.com act as an intermediary between guests wanting to make a reservation and a hotel. These platforms also have a broader reach compared to a hotel’s own website, so while they can direct additional bookings to a hotel, they also charge for the privilege. This, in turn, eats into the hotel’s profit – hence why hotels usually advertise that the best rate is obtained by booking direct.
Loyalty programmes
Almost every major hotel chain has a loyalty programme to encourage travellers to stay with their chain wherever they travel across the globe. Similar to airline loyalty schemes, their hotel counterparts offer varying levels of membership and rewards for staying with a particular chain, or group of hotels.
While slower global economic growth is expected to provide a headwind, hotel investment volumes are expected to hold steady in 2019 as a result of pressure to deploy capital, hotel occupancy and room rates remaining positive and the attractive yield profile hotels generally offer compared to other sectors.
Volume in the Americas is expected to be flat, while an increase in Asian markets is expected to offset a slight decline in Europe. It is expected that total transaction volumes will be US$67.2 billion, essentially unchanged from 2018’s US$67.7 billion.

Europe
Single-asset deals are expected to dominate in the near term. The lower volatility in the return profile of hotels reduces the volatility of funds, while slightly increasing the returns. As such, hotel assets provide a stabilising effect to the diversified funds to which they are added.
Overall, transaction volumes are anticipated to drop between 5% and 10% on 2018, to just over US$21 billion. However, the sentiment towards the asset class remains largely positive, as demonstrated by the acceleration in hotel development activity.
Germany and the UK account for nearly 60% of rooms under construction across Europe. These two markets are expected to absorb the additional supply across the medium term off the back of the strong tourism growth forecasts.
In 2018, Europe received the largest amount of cross-border investment, largely attributed to Asian and Middle Eastern investors. The region is expected to remain an active destination, particularly from Asian investors who are keen to take advantage of currency benefits.
Asia Pacific
Diverse sources of core and core-plus capital are increasingly weighing up investment into hotels. Japan is one of the most active markets due to the Rugby World Cup and Tokyo 2020 Olympics, but China and Singapore are also on investors’ radars, with the positive trend in hotel trading performance set to drive prices upwards.
APAC activity is expected to see a 15% year-on-year increase in 2019, although transaction volumes will still be a modest US$9.5 billion.
All eyes on Japan
Through the first half of 2019, Japan’s hotel market recorded the highest domestic transaction volumes in Asia Pacific at US$1.14 billion. Japanese REITs accounted for almost half of this investment, with demand rising off the back of low borrowing costs and expectations of continued market growth as a result of large-scale events such as the 2019 Rugby World Cup, Tokyo 2020 Olympics and the 2025 World Expo.
The Rugby World Cup is responsible, in part, for the 12% increase in international visitors forecast to descend on Japan throughout 2019. It is reasonable to anticipate an even greater increase in 2020, as 10 million visitors are expected to attend the Olympic Games.
Even though Tokyo will have 170,000 rooms in 2020, up from 30,000 in 2017, a number of prominent hotels are already hanging ‘no vacancy’ signs for the Games, illustrating continued strong demand for at least the next few years.
Americas
In the US, large portfolio deals are expected to dominate investment. Transaction volumes across the Americas in 2019 are forecast to meet the $36.5 billion mark set in 2018. Despite no year-on-year growth, this is still up significantly on the region’s US$28.2 billion transacted in 2017.
2018 represented the tenth consecutive year of growth in North America’s hotel performance, although it appears as though the development pipeline has reached its peak and begun to slow. This has resulted in increased confidence amongst investors, particularly in major markets such as New York.
Mixed-use: Work, stay, play
Mixed-use buildings, combining hotel, residential, office and/or retail space in a single building or precinct have gained increased traction in recent years. Mixed-use buildings increase diversification for investors and allow them to blend their offerings to meet the increasing demands of their guests.
Millennials moving in
Demographics are a major consideration for all hotel investors and operators. In Australia, millennials on average spend the most on accommodation per night. This gives rise to an emerging challenge, particularly given the growing rise of Airbnb amongst this demographic. Hotels must create a point of difference to ensure they continue to attract customers in the face of this popularity.
Rise of the global middle class
The rise of the global middle class also shows no signs of slowing, increasing from 1.8 billion people in 2009, to a forecast 3.2 billion in 2020 and 4.9 billion in 2030. The bulk of this growth comes from Asia, which will represent two-thirds of the global middle-class population by 2030. As a result of this rapid rise, the sheer number of people looking to travel, and stay at a hotel, is growing quickly.
The experience economy
Consumers are also placing less emphasis on acquiring material goods, and more on seeking out experiences. This is particularly evident in the global luxury travel market, which is forecast to reach US$1.1 trillion by 2025, representing a compound growth rate of 4.3% between 2017 and 2025.
This growth is driving demand for hotel stays and investors are looking to capitalise. In 2018, the US saw luxury hotel transactions rise by 76% year-on-year. In Europe, investors are looking to deploy capital to meet this demand in key destination cities such as Paris, Rome and Florence.
Investor diversification
Investors are also seeking alternative options to the traditional real estate sectors of office, industrial and retail to diversify their returns. As pressure mounts to deploy capital, the positive longer-term dynamics continue to heighten the appeal of hotel assets. Across the five years to 2018, 70% of hotel investments were made by investors looking to diversify, rather than those seeking hotel-specific funds.
Hotels, like any other asset class, have positives and negatives as an investment option. However, there is a lot to like about the sector, including its ability to diversify investor portfolios and sustained medium-term growth in demand off the back of the experience economy, tourism boom and continued rise of the global middle class.

The infographic below shows the composition of the US$80 trillion global economy in 2017, the most recent year in which comprehensive figures were available. In nominal terms, the US still has the largest Gross Domestic Product (GDP) at US$19.4 trillion, making up 24.4% of the world economy, nearly 60% larger than China at US$12.2 trillion.
However, in 2016, the International Monetary Fund called the Chinese economy the world’s largest when adjusted for purchasing power parity (which allows you to compare how much your money can buy in relative terms).
Perhaps a more telling statistic is that per capita disposable income is US$39,513 in the US and just US$2,993 in China. This more aptly illustrates just how far China has yet to go to give its citizens a similar quality of life.
The next two largest economies are Japan (US$4.9 trillion) and Germany (US$4.6 trillion). It’s India (US$2.6 trillion), however, which has now passed France and, given Brexit, probably also the UK, which is increasing the fastest. Brazil, despite its very recent economic woes, surpassed Italy in GDP rankings to take the number eight spot overall. Canada rounds out the top ten.
Australia’s GDP was US$1.32 trillion or 1.67% of the global economy, which just about puts it on par with Spain. While punching above Spain and most others in terms of GDP per capita, Australia remains a relatively small economy in global terms.
Australia has often been called the lucky country, given its more than 25-year run without recession. Luck, however, is not a strategy, nor is it sufficient to build a business, execute a strategy or pay distributions. Luck can run out and, diversification, whether or not it’s for personal investing or growing a business, is important.
Diversification doesn’t mean turning your back on what you know or are familiar with (Australia), but it does mean prudently assessing opportunities which can diversify investment portfolios or business income streams both by sector and by geography.
The European real estate market, for example, comprises approximately 350 million sqm of office stock, over 14 times more than the Australian equivalent. The market comprises more than 34 different individual office markets, each with more than 2 million sqm of office space.
To put it in perspective, that’s 34 different markets the size of Brisbane or Canberra that you can choose to invest in. All of these locations will have different local market dynamics, are at different points in the real estate cycle and are in differently performing countries, some of which, like Poland, currently have better prospects than Australia. Diversification matters.

In Insight 27, we provided an overview of the changes currently being experienced by the retail sector globally. The retail landscape varies dramatically from country to country. However, across all borders and economies, understanding the importance of catchment is vital.
Catchment refers to the sphere of influence from which a retail location – for example, a shopping centre – is likely to draw its customers. The general concept of a retail catchment area comprises three major considerations – supply factors, demand factors and consumer interactions.
On the supply side, there is the strength of the offering in terms of a centre’s quality, age, size, location and tenant mix. Alternatively, demand factors include location, population and demographic makeup of the catchment area. The supply and demand factors, in turn, dictate consumer interactions. A centre with a better offering will draw consumers from greater distances than centres with few points of difference to its competitors.
There are, however, a number of other important catchment-related considerations. Firstly, the position of a retail centre within the hierarchy of other local retail centres. This is determined by the format and size of the centre, population density of its catchment, the competitive intensity, and how well its proposition fits the needs of the consumer base.
For example, a high-end boutique centre with luxury fashion retailers would more than likely fare poorly in a low socio-economic area.
Generally, a catchment with a large population will have a greater retail offering, to the extent it acts as an employment hub and economic driver, thereby attracting customers from a wider area. A smaller, or remote catchment, will more than likely serve a different function, be more embedded in local economies and be patronised more frequently by local communities.
In Australia, the Property Council of Australia sets out classifications for shopping centres, which are closely aligned to the concept of ‘catchment’. This is shown below.
The importance of catchment cannot be overlooked. It is vital shopping centre investors and managers understand their catchment area in terms of socioeconomic status, size and demographics, and are able to tailor their offering accordingly.

World gross domestic product (GDP) growth slowed over the last year, but there are some signs that momentum is turning. Central banks have relaxed monetary policy since the start of 2019, Chinese authorities have intervened to support domestic growth momentum, the tariff wars may prove less destabilising than originally thought, and expansionary fiscal policy has been implemented across many key Asian markets.
Global growth is projected to be around 2.9% p.a. on average over the next five years, although Australia’s trading partners’ economies are forecast to grow at 3.8% over the same period. Long-term GDP growth, however, will be structurally weaker than in the past due to slower population growth and more limited improvements in productivity.
 GDP growth remains weak, at 1.4% for the 12 months to 30 June 2019. The key factor remains subdued household consumption. Although lower interest rates and income tax cuts are generally supportive, the Australian consumer seems to have their hands firmly in their pockets.
Residential building has turned down sharply and is likely to be a large drag on growth until late- 2020. Conditions remain conducive to a pick-up in business investment, as monetary conditions are accommodative and utilisation rates are high, but deteriorating confidence and some remaining uncertainty around the global outlook is causing firms to take pause.
Mining investment will trough soon, however, and the absence of any drag will support growth. Underlying export demand continues to be strong and will contribute around 2.1% of GDP growth for FY19 and FY20 before stronger growth of around 3% thereafter.
Employment growth also remains healthy, but price pressures are weak and wage growth is only slowly trending higher. The RBA lowered the cash rate by 25 basis points in June, July and October and is likely to pause now with the cash rate at a record-low 0.75%.
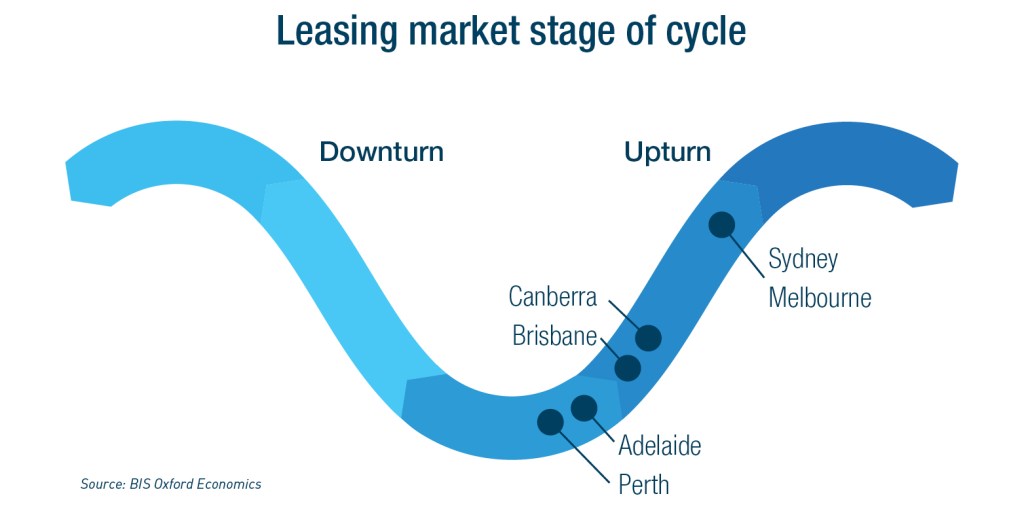
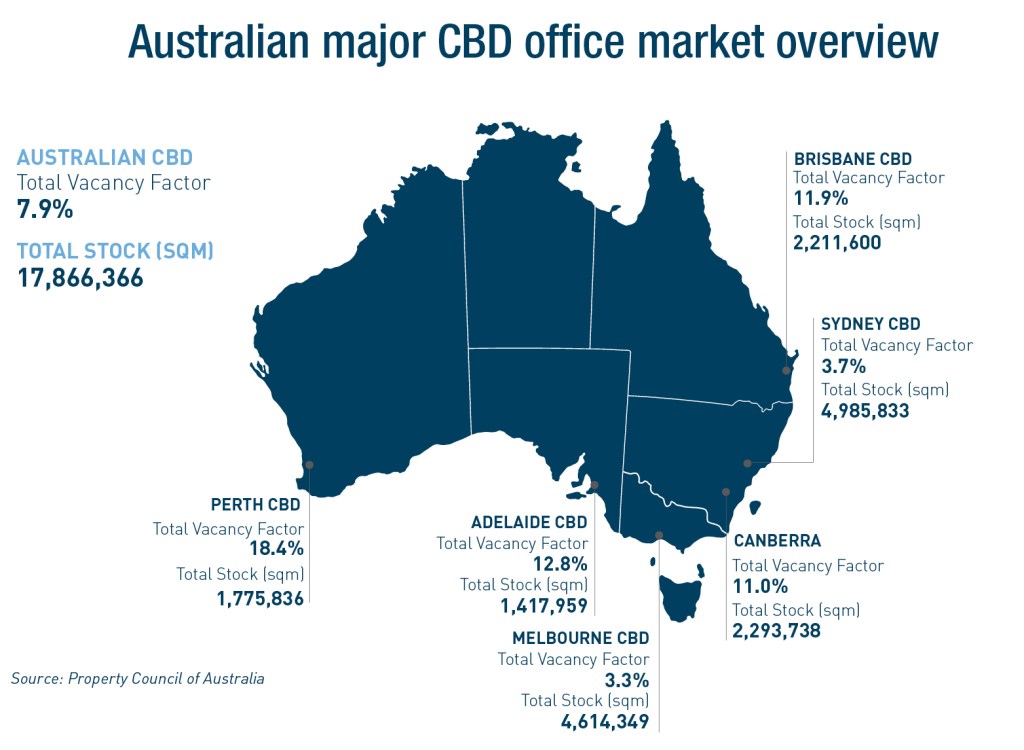
Australia’s major office markets are at different stages of the office cycle. CBD vacancy rates range from 3.3% in Melbourne to 18.4% in Perth. Sydney and Melbourne have the tightest leasing markets and offer strong rental growth prospects over the next five years. They also offer the best five-year investment returns, albeit the ten-year returns are much lower.
For the other major capital city markets, the converse is true. Ten-year returns eclipse five-year returns, reflecting stronger leasing conditions further out in the cycle. In Brisbane, Perth and Adelaide, we are past the trough in the cycle, but recovery in demand will be slow and it will take time for vacancies to fall.
In Brisbane, new supply could delay the recovery. In Canberra, the A-grade market is tight and returns will be solid over the medium to longer-term, but the market remains strongly driven by the requirements of government.
Australia’s eastern seaboard industrial property markets continue to experience strong occupier and investor demand. Construction of new space is struggling to keep pace with demand, leading to declining vacancy rates and, particularly in already built-up areas, putting upwards pressure on rents.
Meanwhile, the sector has delivered strong capital gains over the past five years. Most of that has been the result of firming yields, with rental growth only recently joining the equation. The resulting investment returns were amongst the strongest of all property investment classes in Australia over the past 12 to 18 months.
The retail property market in Australia continues to face difficult conditions. The pace of retail turnover growth is weak from a long-term historic perspective. Data indicates 2.4% year-on-year growth, reflecting the volatility of the sector. The pattern of soft turnover growth is consistent with soft wages growth and weak consumer sentiment.
In the investment market, activity has slowed and, with more sellers than buyers, yields have started to soften for all centre types bar regional centres.
There are numerous examples of properties being sold for below book value or last valuation. We are likely to see further softening of non-core centre yields as investors increasingly question an asset’s income growth prospects.
Investment returns from commercial property across Australia over the next five years will be well below those achieved over the past five years. The strength of recent returns was, for the most part, the result of falling bond rates driving firming yields, often completely out of lock-step with leasing fundamentals. The weight of money chasing investment property fuelled the fall.
Across most capital cities and sectors, yields have continued to firm over the year. Indeed, with bond rates reaching new lows, we have pushed back the expected timing of a turnaround (rise) in bond rates and associated yield softening, although the medium-term direction is unlikely to change.
Near term, yields could continue to firm modestly. There is still a significant differential between yields on offer for Australian property and those in Asian city markets, and both local and international investor demand for Australian property remains strong.
Moreover, most property markets that experienced oversupply following the end of the mining investment boom are now in a recovery stage of the cycle.
Industrial yields appear to offer the greatest scope for near-term firming. By contrast, retail yields (other than for regional centres) are showing signs of softening in response to risks around centre income returns.
As such, we expect office yields in Sydney and Melbourne to soften only once rentals start to decline in about five years. In the smaller city markets, where yields have firmed despite weak leasing conditions, there is a greater risk of yields softening in line with bond rate movements.
Many investors, institutional and private, will struggle to meet current hurdle rates of return on a five-year investment horizon. Lease expiry profile and vacancy risk will be critical, as will be value-add development opportunities. Investors may need to consider either a shorter, or alternatively a longer-term, time horizon for investments to stack up.