December 9, 2019

Research and Insights
Global economic outlook
World gross domestic product (GDP) growth slowed over the last year, but there are some signs that momentum is turning. Central banks have relaxed monetary policy since the start of 2019, Chinese authorities have intervened to support domestic growth momentum, the tariff wars may prove less destabilising than originally thought, and expansionary fiscal policy has been implemented across many key Asian markets.
Global growth is projected to be around 2.9% p.a. on average over the next five years, although Australia’s trading partners’ economies are forecast to grow at 3.8% over the same period. Long-term GDP growth, however, will be structurally weaker than in the past due to slower population growth and more limited improvements in productivity.
Australia’s economic outlook
 GDP growth remains weak, at 1.4% for the 12 months to 30 June 2019. The key factor remains subdued household consumption. Although lower interest rates and income tax cuts are generally supportive, the Australian consumer seems to have their hands firmly in their pockets.
Residential building has turned down sharply and is likely to be a large drag on growth until late- 2020. Conditions remain conducive to a pick-up in business investment, as monetary conditions are accommodative and utilisation rates are high, but deteriorating confidence and some remaining uncertainty around the global outlook is causing firms to take pause.
Mining investment will trough soon, however, and the absence of any drag will support growth. Underlying export demand continues to be strong and will contribute around 2.1% of GDP growth for FY19 and FY20 before stronger growth of around 3% thereafter.
Employment growth also remains healthy, but price pressures are weak and wage growth is only slowly trending higher. The RBA lowered the cash rate by 25 basis points in June, July and October and is likely to pause now with the cash rate at a record-low 0.75%.
Office markets
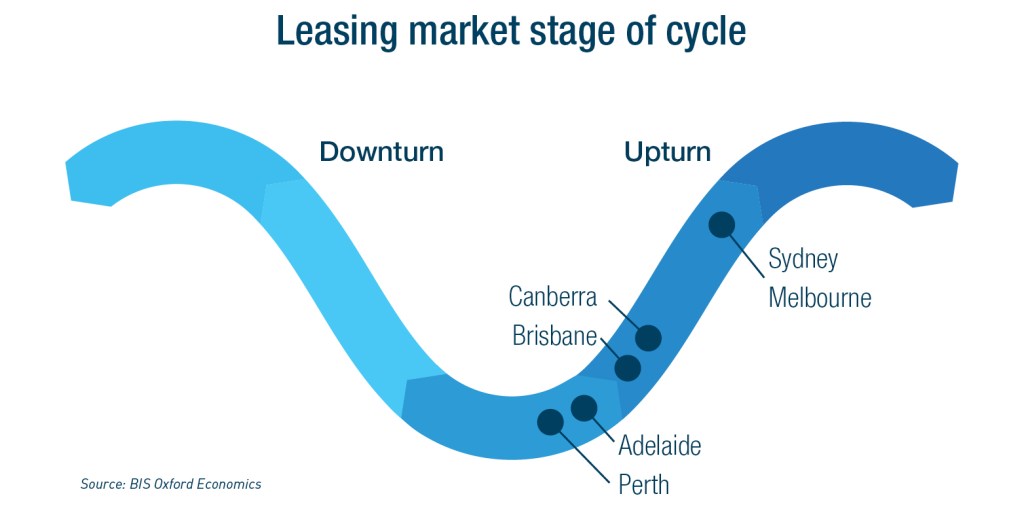
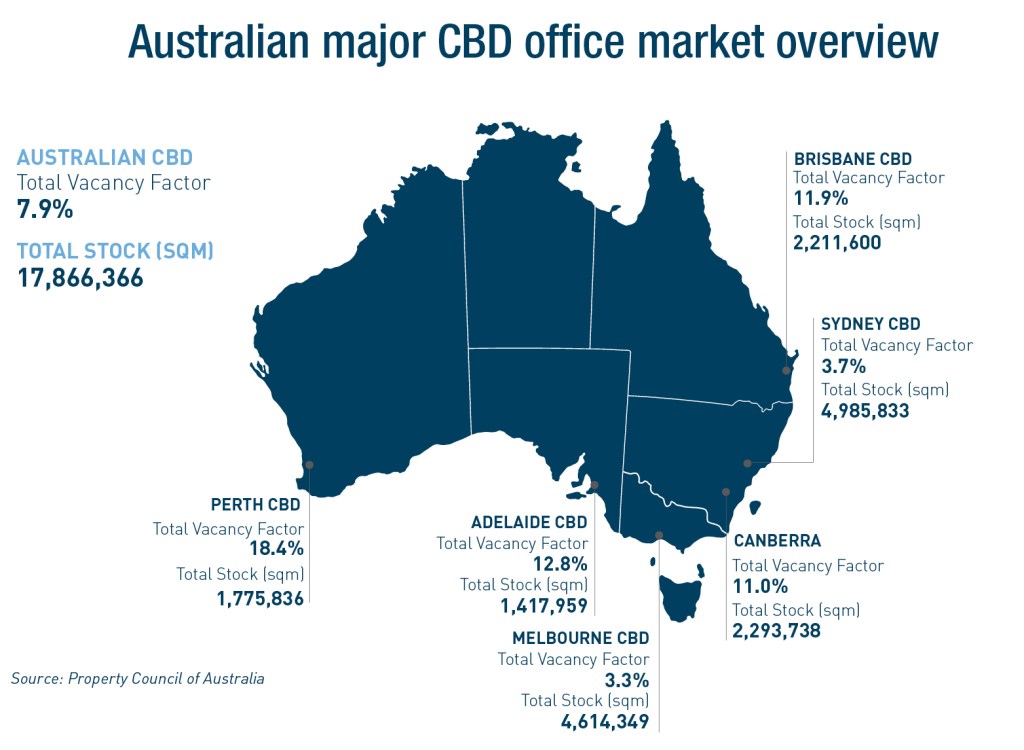
Australia’s major office markets are at different stages of the office cycle. CBD vacancy rates range from 3.3% in Melbourne to 18.4% in Perth. Sydney and Melbourne have the tightest leasing markets and offer strong rental growth prospects over the next five years. They also offer the best five-year investment returns, albeit the ten-year returns are much lower.
For the other major capital city markets, the converse is true. Ten-year returns eclipse five-year returns, reflecting stronger leasing conditions further out in the cycle. In Brisbane, Perth and Adelaide, we are past the trough in the cycle, but recovery in demand will be slow and it will take time for vacancies to fall.
In Brisbane, new supply could delay the recovery. In Canberra, the A-grade market is tight and returns will be solid over the medium to longer-term, but the market remains strongly driven by the requirements of government.
Industrial market overview
Australia’s eastern seaboard industrial property markets continue to experience strong occupier and investor demand. Construction of new space is struggling to keep pace with demand, leading to declining vacancy rates and, particularly in already built-up areas, putting upwards pressure on rents.
Meanwhile, the sector has delivered strong capital gains over the past five years. Most of that has been the result of firming yields, with rental growth only recently joining the equation. The resulting investment returns were amongst the strongest of all property investment classes in Australia over the past 12 to 18 months.
Retail sector outlook
The retail property market in Australia continues to face difficult conditions. The pace of retail turnover growth is weak from a long-term historic perspective. Data indicates 2.4% year-on-year growth, reflecting the volatility of the sector. The pattern of soft turnover growth is consistent with soft wages growth and weak consumer sentiment.
In the investment market, activity has slowed and, with more sellers than buyers, yields have started to soften for all centre types bar regional centres.
There are numerous examples of properties being sold for below book value or last valuation. We are likely to see further softening of non-core centre yields as investors increasingly question an asset’s income growth prospects.
The outlook for property returns
Investment returns from commercial property across Australia over the next five years will be well below those achieved over the past five years. The strength of recent returns was, for the most part, the result of falling bond rates driving firming yields, often completely out of lock-step with leasing fundamentals. The weight of money chasing investment property fuelled the fall.
Across most capital cities and sectors, yields have continued to firm over the year. Indeed, with bond rates reaching new lows, we have pushed back the expected timing of a turnaround (rise) in bond rates and associated yield softening, although the medium-term direction is unlikely to change.
Near term, yields could continue to firm modestly. There is still a significant differential between yields on offer for Australian property and those in Asian city markets, and both local and international investor demand for Australian property remains strong.
Moreover, most property markets that experienced oversupply following the end of the mining investment boom are now in a recovery stage of the cycle.
Industrial yields appear to offer the greatest scope for near-term firming. By contrast, retail yields (other than for regional centres) are showing signs of softening in response to risks around centre income returns.
As such, we expect office yields in Sydney and Melbourne to soften only once rentals start to decline in about five years. In the smaller city markets, where yields have firmed despite weak leasing conditions, there is a greater risk of yields softening in line with bond rate movements.
Many investors, institutional and private, will struggle to meet current hurdle rates of return on a five-year investment horizon. Lease expiry profile and vacancy risk will be critical, as will be value-add development opportunities. Investors may need to consider either a shorter, or alternatively a longer-term, time horizon for investments to stack up.
Research and Insights
October 1, 2019
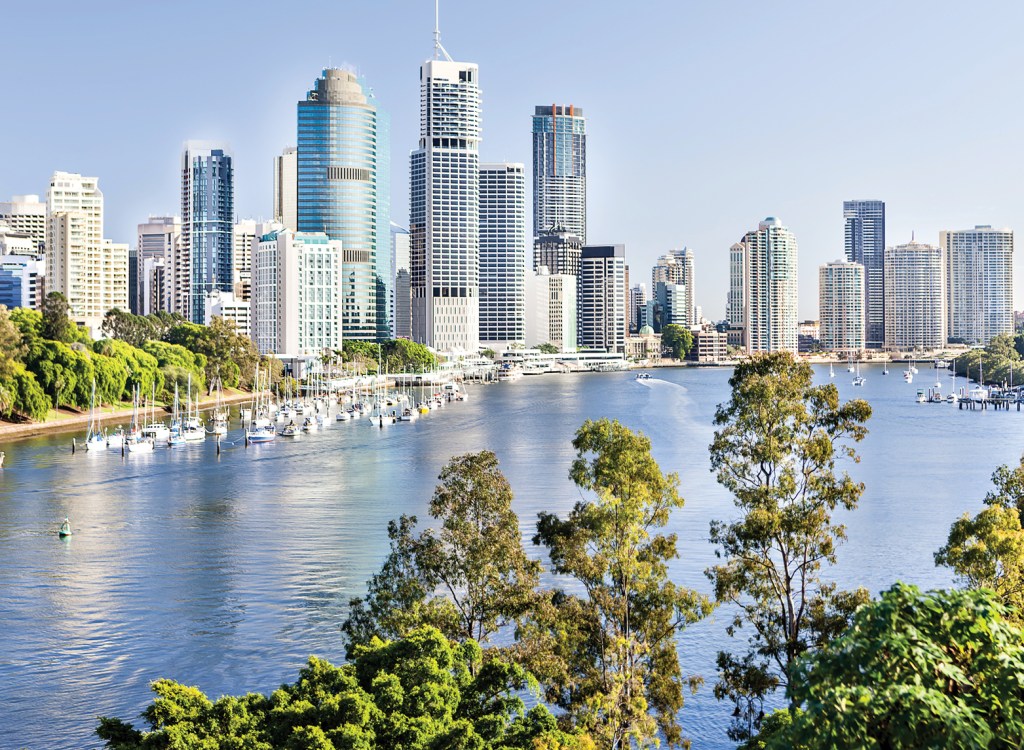
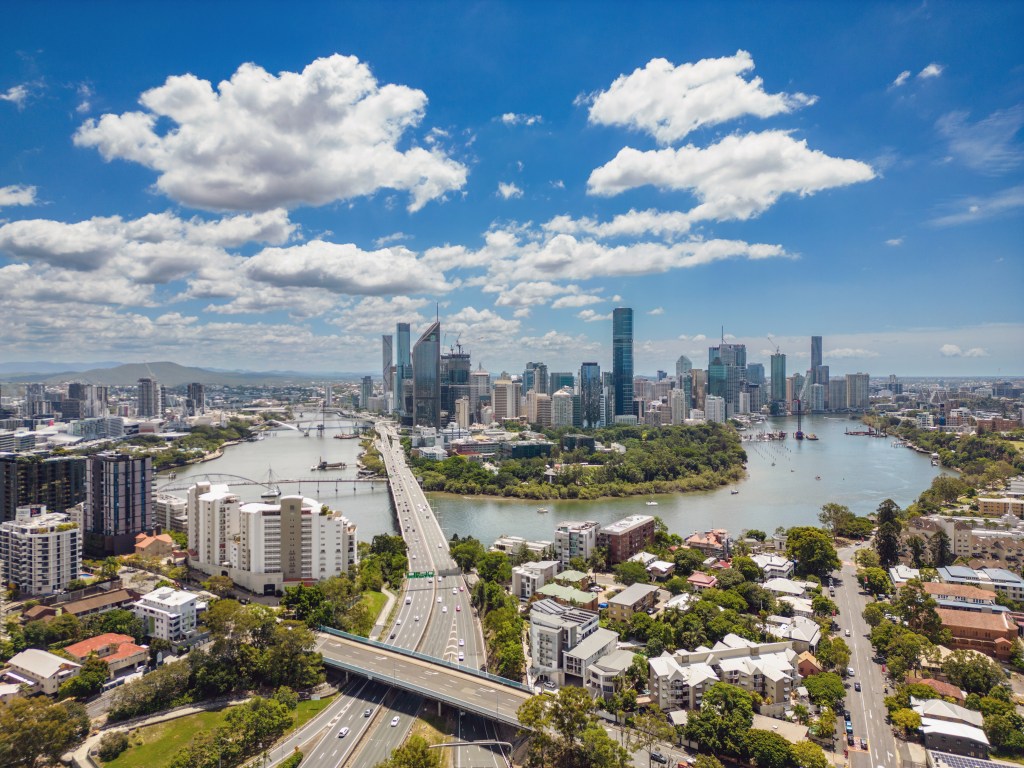
Brisbane: The new world city
Jack Green
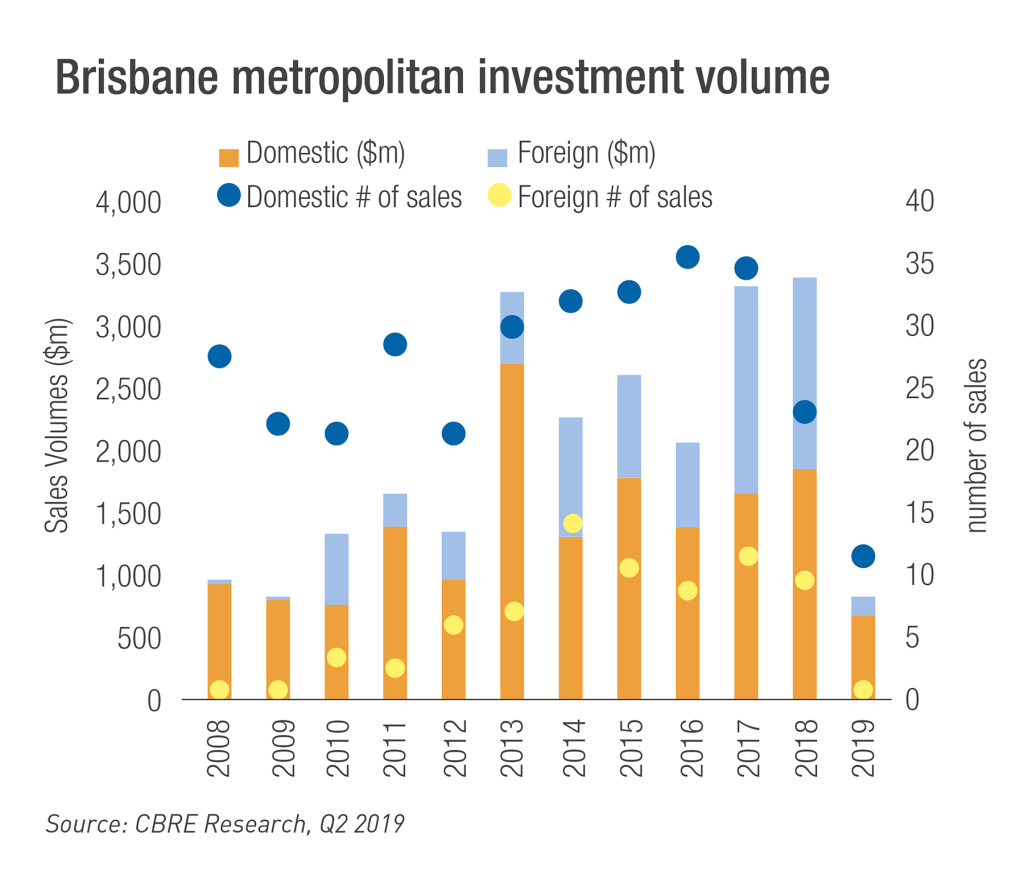
Brisbane continues to transform itself into a self-titled ‘new world city’. It is a destination for both domestic and international real estate investors off the back of Queensland’s improving economic growth and a multibillion-dollar infrastructure pipeline.
Where does Brisbane sit in the Australian commercial real estate market?
 Brisbane CBD comprises over 2.2 million sqm of office stock, making it just under half the size of the Melbourne CBD and slightly smaller again when compared to Sydney. Its vacancy, however, is a lot higher, albeit on a downward trajectory having dropped to 11.9%, from 12.9% just six months previously. Brisbane fringe vacancy contracted from 15.7% to 13.8% over the same period.
This improvement indicates Brisbane is continuing to recover from its record-high vacancy rates after the end of the mining boom. The 11.9% Brisbane CBD vacancy rate is currently the lowest it has been since early-2013, indicating strong sentiment regarding the ‘River City’. This sentiment is amplified given the fact that Perth, the other major resource-driven office market, continues to struggle, with vacancy at 18.4% and incentives upwards of 50%.
Queensland’s economic fundamentals are mixed. According to CommSec’s July 2019 State of the States Report, Queensland ranks fifth in Australia in terms of overall economic performance, despite having the nation’s third best relative economic and population growth.
The State of the States Report, however, does not incorporate Gross State Product, a category in which Queensland (3.4%) outperformed the Australian average (2.8%) in 2018. Queensland’s unemployment rate is 6.0% at present, above the national average of 5.1%.
Overall, the Queensland economic outlook seems able to withstand weakening global and domestic conditions, particularly as a weaker currency is a positive to growth in key sectors such as resourcing, tourism and international students. Additionally, the reduction in housing construction has been offset by increased commercial construction and business investment in and around the Brisbane CBD.
Office outlook
A turnaround in the Brisbane CBD office market is slowly emerging, with an optimistic outlook for the remainder of 2019 and beyond. It is reasonable to anticipate the state’s economy will continue to pick up and investment sentiment to increase off the back of Australia’s weakening dollar. Significant public infrastructure investment and steady population growth will also help.
Investors seeking higher yielding assets have been looking at the Brisbane market for a while now, with 2019 on track to be a record year in terms of investment. The estimated volume of sales, either settled, pending or under due diligence, reached approximately $2 billion through the first half of the year. Only the limited availability of stock seems to be a hindrance for investors.
Rents appear likely to continue to edge upwards as vacancy drops, dictated by a positive combination of relatively low new supply and stronger tenant demand.
This should drive some further tightening of capitalisation rates as domestic and offshore investors continue to take advantage of the yield discrepancy between Brisbane, its southern counterparts and also comparable international city destinations.
One potential negative, however, is the proposed Queensland Government land tax change. This continues to be lobbied against by the industry but, if legislated as is, is likely to negatively impact foreign investors. On top of increases to existing land tax rates, which now range from 1.7% to 2.75%, a new proposed land tax foreign surcharge of 2% will apply to foreign companies.
Why Brisbane?
International destination
Brisbane is one of Australia’s primary tourist destinations, with its array of restaurants, galleries and shopping, but it also acts as a gateway to everything else Queensland has to offer. The Great Barrier Reef, Whitsunday Islands and rainforests of Far North Queensland are a short flight away, while the Gold Coast and its famous beaches are within driving distance.
In 2018, Queensland’s international visitor count for the year grew 2.3% to 2.8 million. The weak Australian dollar is helping drive an increase in tourism, with international tourists flocking down under, as well as nationals forgoing an international holiday to travel domestically.
It’s not just tourism drawing international visitors to Brisbane. With seven world-class universities and a number of private schools accommodating international students, it is no coincidence international enrolments in Queensland educational facilities rose 9.1% in 2018.
Liveability
When measured against cities across the world, Brisbane is attractive for its liveability.
In 2019, The Economist ranked Brisbane 18th out of 150 cities worldwide, based on the criteria of stability, infrastructure, education, healthcare and environment. Mercer, which uses similar yet more extensive criteria, placed Brisbane at number 35 out of 231 cities evaluated in their 2018 Quality of Life index.
Relative value
Along the east coast of Australia, Brisbane’s residential market is comparatively well placed. As at March 2019, the median apartment value in Brisbane was $372,900, whilst Melbourne was $466,900 and Sydney a whopping $696,900. Similarly, for houses, Brisbane holds an average price of $563,700, while Melbourne’s $809,500 and Sydney’s $1.03 million sit far higher.
Those priced out of the residential market in the southern cities can find value in Brisbane.
Brisbane is well placed within the wider Australian commercial market, and has an abundance of infrastructure projects in the works. It is little wonder the ‘River City’ is becoming an increasingly popular destination for international real estate investors.
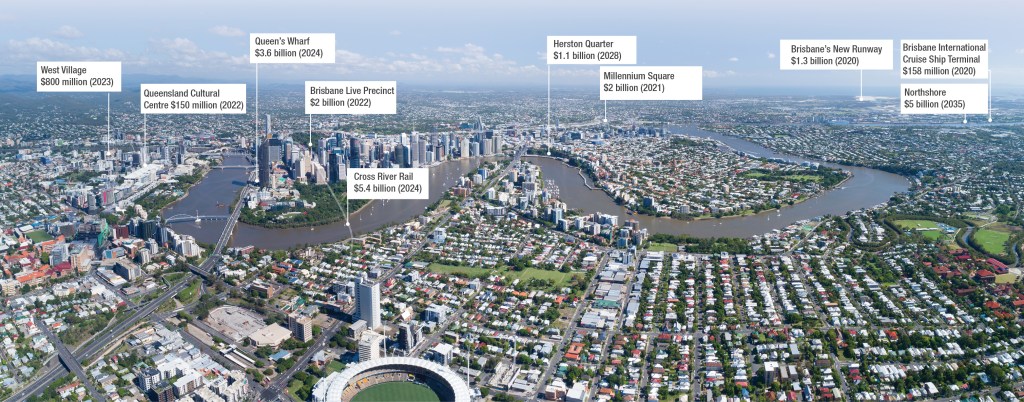
| Project | Cost | Estimated Completion | Description |
| Cross River Rail | $5.4 billion | 2024 | Set to be utilised by more than 160,000 commuters daily, the 10.2-kilometre rail line between Dutton Park and Bowen Hills will consist of almost six kilometres of tunnel beneath the Brisbane River and CBD. |
| Northshore | $5 billion | 2035 | With construction beginning in 2020, and spanning an area of 302 hectares, Northshore will be Queensland’s largest urban renewal project, consisting of high-end apartments, commercial space, retail, restaurants and bars. |
| Queen’s Wharf | $3.6 billion | 2024 | The 26-hectare integrated resort development will consist of five new hotels, as well as 50 bars, restaurants and cafes, a pedestrian bridge to Southbank, and is expected to draw an additional 1.39 million visitors to Brisbane each year. |
| Brisbane Live Precinct | $2 billion | 2022 | The Brisbane Live Precinct, located in Roma Street, will centre around a new 17,000-seat arena. |
| Millennium Square | $2 billion | 2021 | Millennium Square, located in Bowen Hills, is touted as the ‘city within a city’. It will consist of a state-of-the-art multimedia hub, residential towers, entertainment facilities and one-hectare garden. |
| Brisbane’s New Runway | $1.3 billion | 2020 | Brisbane’s New Runway is currently the largest aviation construction project in Australia. Once complete, Brisbane will have the best runway system in Australia, and current aircraft capacity will effectively be doubled. |
| Herston Quarter | $1.1 billion | 2028 | Linking old with new, Herston Quarter is set to become one of the nation’s largest and most complex biomedical precincts. The redevelopment is set to showcase the area’s local heritage, as well as provide aged care and retirement living, and residential accommodation. |
| Brisbane Metro | $944 million | 2023 | Construction has begun on Brisbane Metro, which will be a key part of Brisbane’s greater transport network, connecting the city to the suburbs. |
| West Village | $800 million | 2023 | Located on the fringe of Brisbane’s CBD, West Village will include seven residential buildings and about 13,000 sqm of retail and commercial space, alongside one hectare of open space linked by pedestrian and cycle laneways. |
| Brisbane International Cruise Ship Terminal | $158 million | 2020 | South-east Queensland currently does not have a dedicated facility able to accommodate mega cruise ships. However, once complete, the Brisbane International Cruise Ship Terminal will be able to cater to the largest vessels in the world. |
| Queensland Cultural Centre | $150 million | 2022 | The new development at Southbank will serve as the Queensland Performing Arts Centre’s fifth theatre, and will in turn make QPAC the largest performing arts centre in Australia. |
Research and Insights
October 1, 2019
UK office market: Steady despite headwinds
Joanna Tano
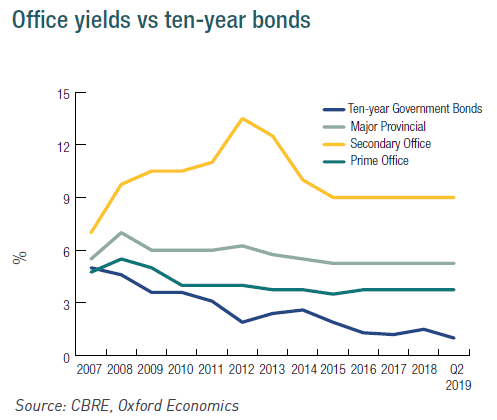
Activity, from both occupiers and investors, in the UK’s office sector recorded a relatively positive Q2 amidst the continued Brexit haze. While political uncertainty has tempered market activity, deals are being done, prime yields are at, or close to, historic lows, supply-strapped markets are seeing an uptick in headline rents and the resilience of the UK office market is evident.
Addressing the uncertainty of Brexit head on, there were inevitably some companies who decided to move some of their operations away from the UK when the outcome of the 2016 Brexit Referendum was announced. Further, there are some that have decided they cannot live with the continued delay to the outcome of Brexit and have relocated some staff. Finally, there are some companies that are looking at their structures and where their personnel are based and restructuring, unrelated to Brexit.
However, there are some, possibly overlooked headlines of positive job creation and investment banks buying their headquarter buildings. This further demonstrates the resilience of not only London, but the UK market as a whole. Unemployment is at its lowest level in a generation, which is finally seeing some real wage growth. Immigration levels might be lower than in the recent past, but the working-age population will still expand through natural increases and further rises in the state pension age.
The UK is in a leading position in several service sectors such as financial and business services. Additionally, according to JLL’s ‘Innovation Geographies’ report, London has the highest concentration of talent in the world due to its leading universities and a highly-educated workforce.
GDP growth is expected to reach 1.3% in 2019, stronger than the Eurozone average, suggesting a subdued but nonetheless encouraging level of confidence in the economy given the political situation and lack of a definitive outcome of Brexit. The latter will continue to deter some business investment until the UK’s future trading relationship with the EU becomes clearer, but businesses must continue to operate and cannot, therefore, take no action.
Investor appetite for the UK
The UK real estate market offers size, diversity of product, depth of investors and breadth of occupiers all of which contribute to its appeal. Additionally, liquidity, transparency and high-quality stock in large lot sizes makes it one of the most significant markets in Europe.
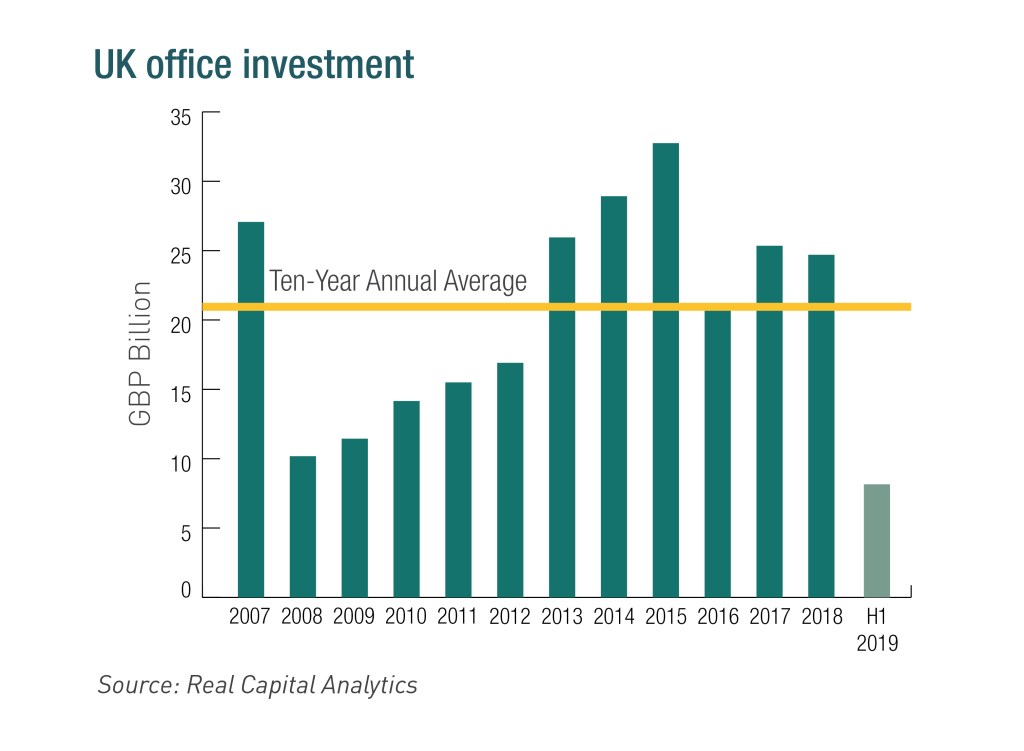
In 2018, over £60 billion transacted, approximately 20% above the ten-year annual average. Both 2017 and 2018 trading volumes were above those of Brexit-year 2016, unlike the dramatic falls in activity following the GFC in 2008, after which volumes took at least five years to recover to pre-crisis levels.
In 2018, the office sector accounted for a 40% share of activity. £8.2 billion was invested into UK offices in H1 2019 – mirroring the expected slowdown following the decision to extend the Brexit deadline to October, and partly due to the flurry of deals that closed in the final quarter of 2018.
With limited distress evident and vendor expectations on pricing remaining high, some deals are being held back. There is, however, a noted rise in risk-aversion among some investors given the political landscape. Due diligence is tending to take longer as the market has reached a mature stage of the cycle, which is also impacting on lower investment volumes.
Simply, investors are taking a more considered approach. There is some, albeit limited, evidence that yields are beginning to soften in some secondary markets, which will present opportunities for investors willing and able to take a possible capex, long-term position.
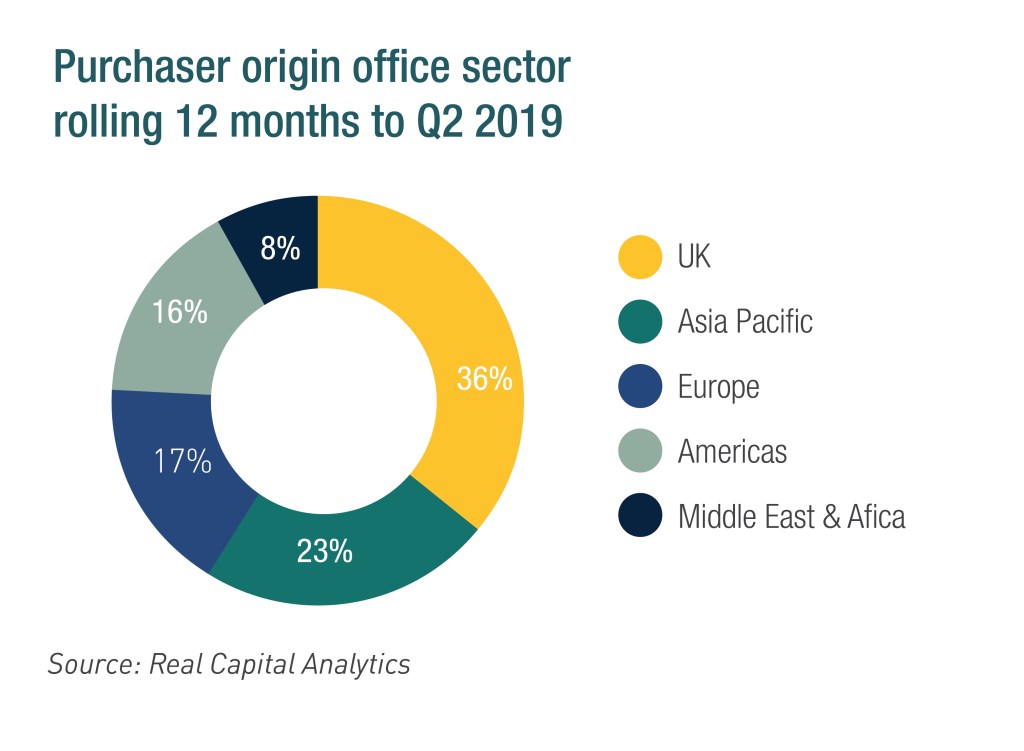
The investor base remains broad, and looking back over the past 12 months, domestic buyers remained active (36%) with Asian buyers the next largest group, specifically capital from Singapore and South Korea. Different capital sources are seeing opportunities in different areas.
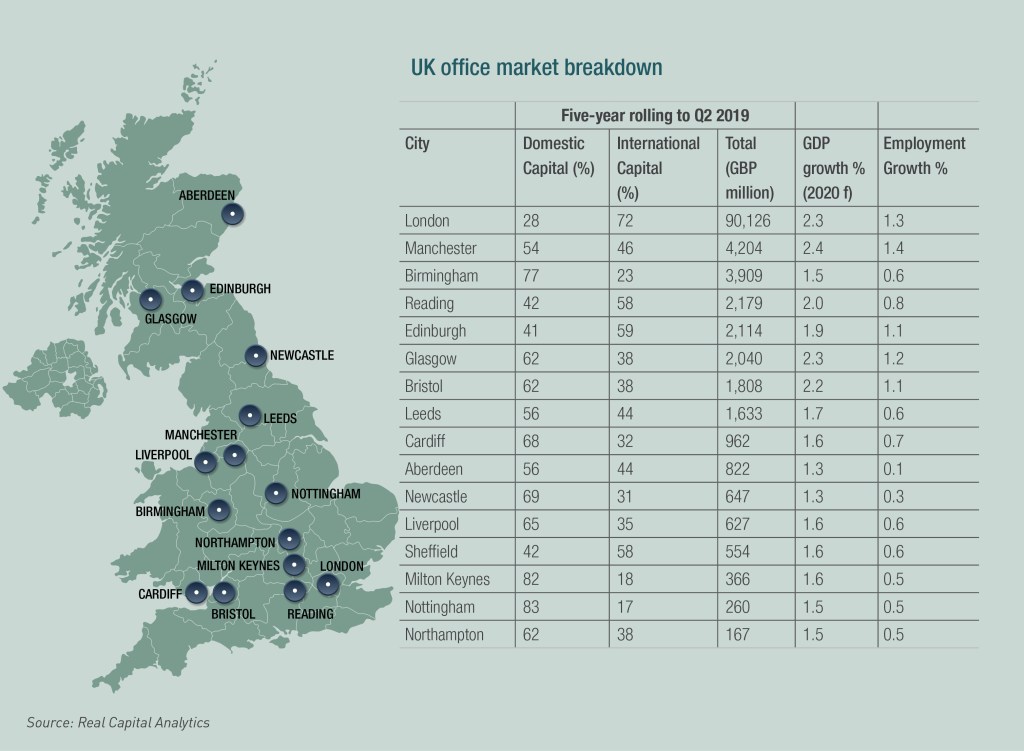
London, Europe’s leading gateway city, retains its crown in the UK office market, consistently attracting around 75% year-on-year of total capital inflows into the office sector. Manchester and Birmingham round out the top three spots. Private equity is more attracted to value-add opportunities with a focus on London, while longer-term capital such as Korean, is buying into the growth story of the stronger performing regional cities.
What’s happening in the occupational market?
Fundamentals are robust by and large, with performance primarily driven by the lack of supply across key centres and supporting rental growth, especially at the quality end of the market. Development activity is increasingly constrained, with pipelines limited in a number of key locations. This does, however, present opportunities for the redevelopment and repositioning of secondary stock as companies continue their ‘flight-to-quality’ strategies.
Vacancy in London is 4.25%, having declined since the beginning of the year despite a slower Q1 2019 in terms of take-up, with Q2 seeing a more robust performance. More stock is coming through, with an estimated 13.2 million square feet (1.2 million sqm) under construction, but this is unlikely to dramatically impact the level of availability as around 55% has already been let or is under offer.
Active demand is also holding up well against the political headwinds, and at approximately 3.7 million square feet (344,000 sqm) is above the ten-year average of around 3.0 million square feet (279,000 sqm), suggesting the slower start to the market is not here to stay and a pick-up in activity will follow in the coming months.
With that said, there are further reasons for optimism. Both the professional services and technology sectors are forecast to account for the majority of London’s GDP growth in the next five years, which should translate to a need to increase headcount. Oxford Economics highlights other positives for London, including the continued high performance of London’s universities and colleges, an unusually young population, flexible labour market, and relatively easy access to finance. These strengths should help counteract the negative impact from Brexit as well as the threats to the global economy.
Regionally, 2.34 million square feet (217,000 sqm) of space was let in Q2 across the ‘Big Nine’*, bringing the half-year total to 4.3 million square feet (399,000 sqm), 10% above the long-term average. Activity was heavily focused on larger deals, quality space in city centres and flexible space. The technology sector was very active while there was a retraction from traditional sectors such as financial, professional and business services.
What are landlords doing? Flexible working
Landlords need to be creative and flexible. The way that office space is being used is changing, and owners and investors need to be open and responsive to these changes while looking to preserve income streams. The war on talent continues and the need for companies to tap into talent pools and having them accessible to transport infrastructure is increasingly important, as is the need to provide services and amenities in the office that were unheard of ten years ago.
Technological advancements, supporting the changing needs and lifestyles of employees and facilitating the rise of small businesses, as corporates strive to facilitate a productive workforce, are boosting the need for flexible space. In addition, the desire from larger corporates to have space they can expand into and divest from at short notice is more prevalent in today’s world than ever before.
Co-working space is gaining prominence amongst flexible operators. Conventional landlords are making a move to enter the market as well, rather than simply rent their buildings to flexible operators, they are looking to take a share of the profits.
Flexible workspace providers remain an important driver of leasing activity, accounting for 15% – 20% of office take-up in the UK capital over the past three years. The UK is also an important and growing market for flexible workspace solutions, with the concept being increasingly adopted with new entrants to the market alongside the established providers. Currently an estimated 5.1% of Central London’s office stock is occupied by flexible workspace operators, up from just 0.8% in 2008.
Given their success in meeting the needs of their customers, this trend is here to stay.
Conclusion
The UK may not be for all investors at the moment, but there are opportunities to be had. The UK continues to attract capital despite the backdrop of political uncertainty and a slower economic environment. For those that are taking a longer-term view and can see through the noise, supply constraints and a lack of speculative development remain key drivers of performance.
While transaction volumes are down, loan-to-value ratios and debt levels are lower than before the GFC, meaning any disruption due to Brexit is likely to be relatively limited, particularly for long-term investors.
Research and Insights
October 1, 2019
The changing face of retail
Jack Green
For investors and operators alike, the phrase ‘traditional retail’ currently invokes feelings of uncertainty and dread, and there is a level of panic associated with the demise of brick and mortar retail. But is the fear of the so-called ‘retail apocalypse’ warranted?
Not all retail is created equal
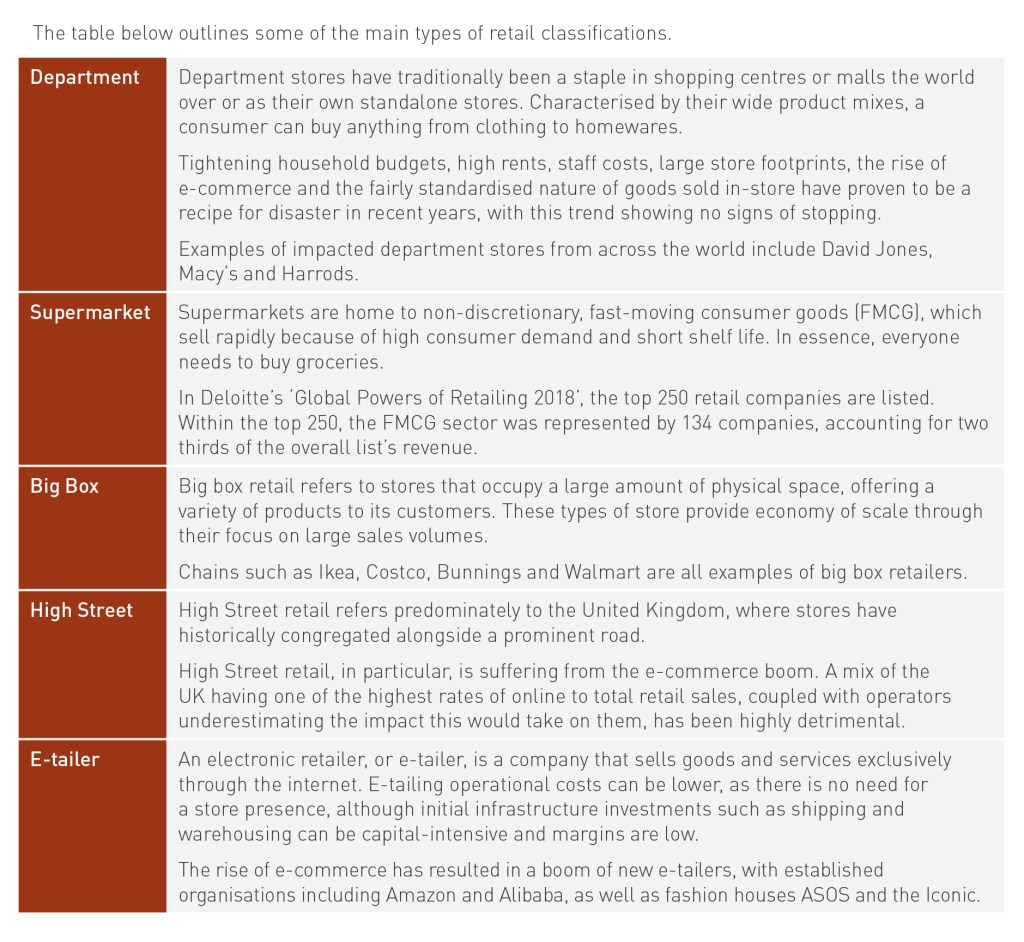 The retail landscape varies dramatically from country to country. The United Kingdom is the home of high street retail, where the United States is the land of not only the free, but also the shopping mall and has more shopping space per person than anywhere else in the world.
Australia has traditionally been a mix of shopping centres, big box retail (think Ikea) and everything in between, while just about every European country has a different story to tell.
What is consistent, however, is that the retail landscape at present, wherever you may be, is very much a case of adapt or perish. A primary driver of this outlook is the rise of e-commerce, which has disrupted many traditional retailers. As such, the industry has reached a point of no return, where longstanding beliefs are no longer a ticket to success.
Adaptation to quickly changing consumer behaviours is not necessarily easy for retailers, but is paramount in order to attract and retain customers. For those who can adapt, there has arguably never been a better time to be a retailer, or investor – if you know where to look.
Despite sensationalist headlines about the ‘retail apocalypse’, consumers still go shopping. While run-of-the-mill discretionary goods spend is highly vulnerable to e-commerce and tightening household budgets, non-discretionary goods and experiential factors are still prominent. As such, brick and mortar stores, are still unmatched when it comes to creating a shopping experience.
The impact of e-commerce
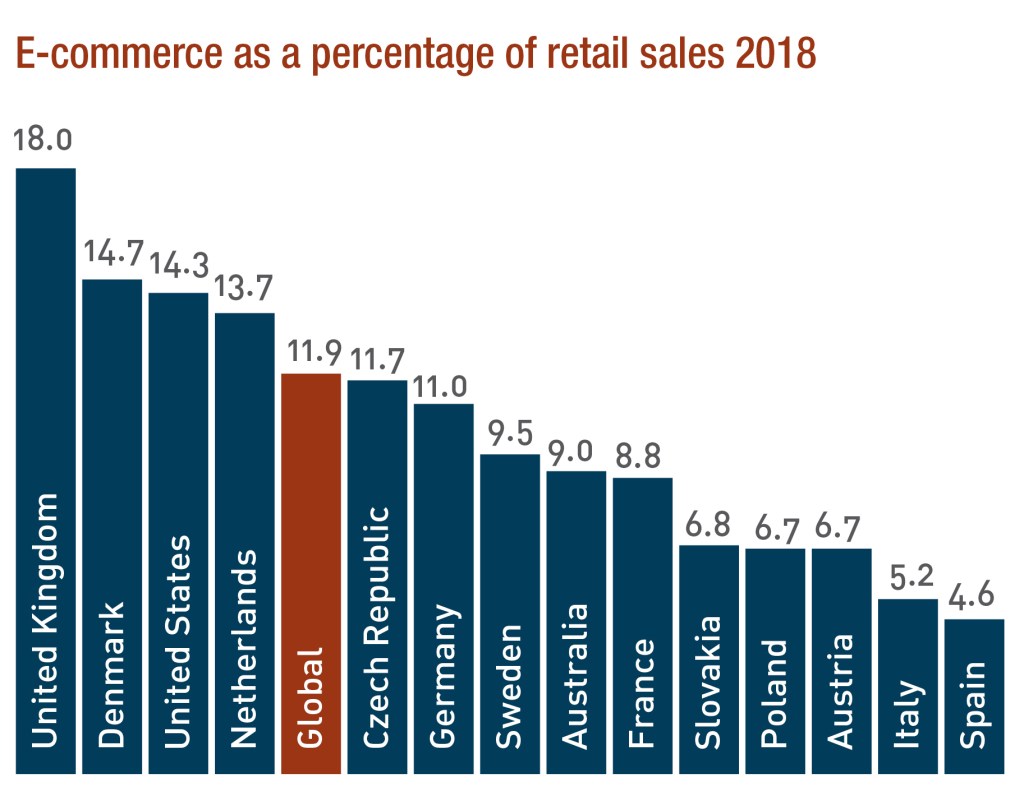 As online sales reach 11.9% of total retail sales globally, up from 7.4% in 2015 and forecast to reach 17.5% by 2021, there seems to be no sign of a reprieve for traditional operators who have not embraced the internet.
In terms of uptake for e-commerce purchase patterns, Australia lags behind about half of Europe, as well as the US, at 9% of total sales. The UK leads the pack at 18% of total retail sales, with the US sitting at just over 14%.
Between 2018 and 2023, e-commerce growth will be headlined by the United States, increasing 45.7% to US$735.4 billion per annum. France, 45.6% growth to US$71.9 billion p.a., Australia, 44.6% to US$26.9 billion p.a., and Germany, 35.6% to US$95.3 billion p.a., follow closely. The UK is anticipated to grow by less, 31.3%, to US$113.6 billion a year, but this is from a high base.
Online behemoths such as Amazon, who accounted for 40% of the United States’ online retail in 2018, continue to change the way in which consumers buy goods. The widely-held position is that this is to the detriment of traditional stores. This is evident through the demise, or seemingly impending demise of a number of big-name chains, such as Barneys New York recently filing for bankruptcy, David Jones’ owners writing down the department store’s value by $437 million, and two UK high street stalwarts, Boots and Mark & Spencer, announcing plans to close more than 300 stores between them.
The waning wealth effect
Coupled with e-commerce and cost of living pressures, the waning wealth effect also continues to impact retail investment decisions. These forces are altering consumer shopping behaviours, what they spend money on, and ultimately the performance of different retail subtypes.
Tightening of household budgets means consumers are ringfencing their non-discretionary spend while reducing their discretionary spend to the detriment of department and big box stores, as well as High Street retail.
Rental costs
Retail rents have also begun to plateau, with downward readjustments occurring in an attempt to save struggling brick and mortar stores. However, legacy players are encumbered by high rents (often fixed and escalating), high debt levels that need to be addressed and changing consumer tastes from a discerning and cost-conscious consumer.
Even though rental growth has begun to stall, this is off the back of decades-long growth. For example, the most expensive retail location on earth in 1998, East 57th Street in New York, cost approximately US$425 per square foot (US$4,575 per sqm). Fast forward to 2018, and Causeway Bay in Hong Kong took top honours for the sixth time, with a top rent of US$2,671 per square foot (US$28,750 per sqm) – a six-fold increase.
City Council researchers in New York reported that average Manhattan rents rose 44% to US$156 per square foot (US$1,679 per sqm) between 2006 and 2016. Across the East River, Brooklyn retail rents averaged at least US$100 per square foot (US$1,076 per sqm) in 15 neighbourhoods as of 2017, up from three a decade prior.
The UK High Street is in a similar predicament with landlords consistently increasing rents. Retailers were on the expansion trail in the noughties, blissfully unaware the impact of e-commerce would have just over a decade later.
 Capital: Influx or in flux?
Global
Institutional investors appear disinterested in retail assets halfway through 2019. The global retail outlook remains very much the same as it did early in the year – a degree of uncertainty clouds the economic outlook. A slowdown in China has weakened growth in emerging markets and some export-focused economies like Japan and Germany. The possibility of a no-deal Brexit has also weakened sentiment, as have the prolonged trade tensions between Trump’s United States and China. Equity markets have mostly bounced back from the lows experienced towards the end of 2018, but volatility still remains.
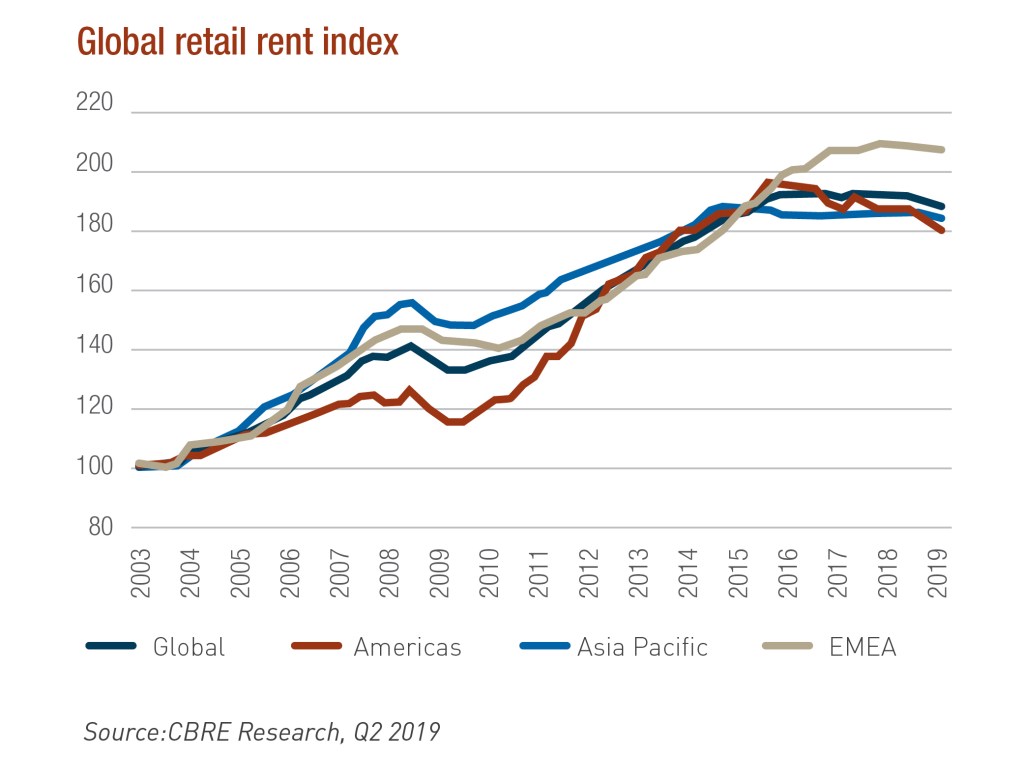
The retail sector continues to adjust to structural shifts, as global investment volumes in H1 2019 fell 20% on H1 2018 figures. The biggest decline was felt across Europe, the Middle East and Africa (EMEA), with H1 volumes down 43% year-on-year. The US saw a 10% decrease in H1, but on the flipside, Asia Pacific (APAC) saw a 7% rise in transaction volume.
Europe
To 30 June this year, just under 400 deals each valued at €5 million or more were closed, a stark decline on the 651 deals of a similar size through H1 2016. In terms of volume, the 400 aforementioned deals totalled €12.7 billion, which is contextually low given the €36.9 billion dealt in H1 2015.
Further, firms raising capital for strategies including retail peaked at US$3.5 billion through the first half of the year, down significantly on the last couple of years.
Australia
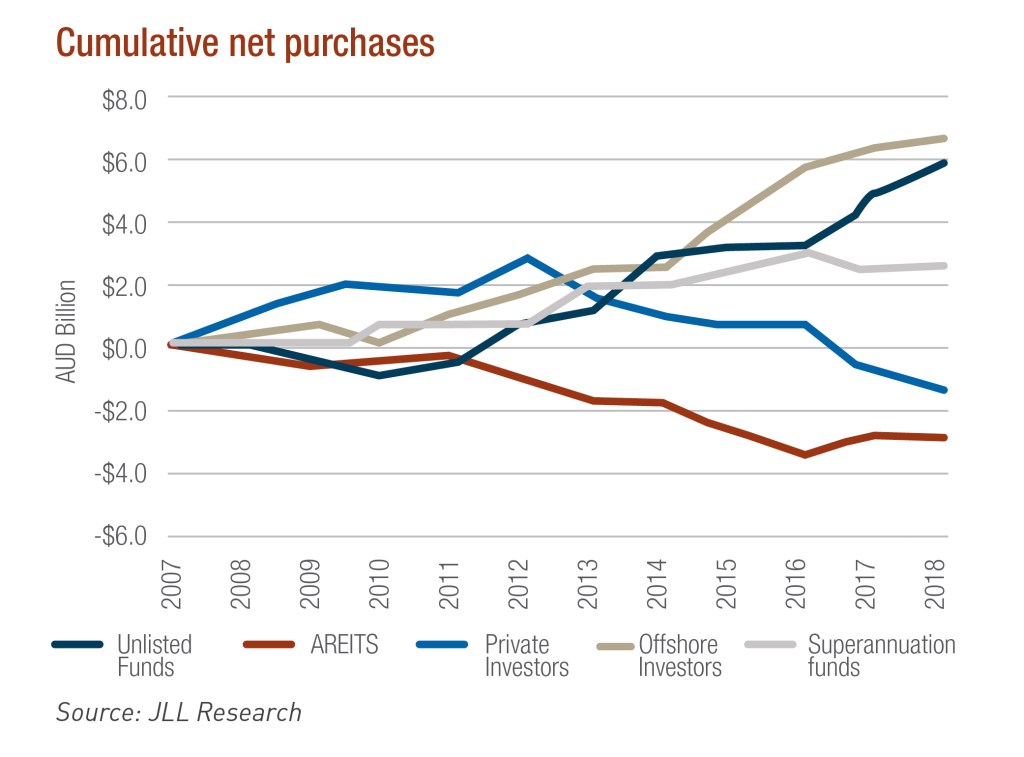
Retail transaction activity reached $8.1 billion in 2018, the third highest level on record. Unlisted funds dominated these acquisitions and it is anticipated the trend of transferring from listed to unlisted ownership will continue throughout 2019 as AREITs continue to refine their portfolios.
However, investors are proceeding with caution when it comes to retail fundamentals, particularly with regard to income stability and capital intensity.
United States
Marred by a spate of closures this year – approximately 7,500 of which were announced by major chains in the first half of 2019 alone – US retailers continue to be battered by high costs, competition from e-commerce and the debt burden carried from past leveraged buyouts.
Despite this, investors remain active. In the first quarter of 2019, US$11.1 billion in assets were traded, and despite a -4.9% year-on-year change, institutional investors are keen to deploy capital for well-located assets in primary or high-growth secondary markets.
What lies ahead?
 Omni-channel retailing
Retailer success will depend significantly on a sound omni-channel strategy. Across most categories and price points, transactions are shifting online and retailers are using their store networks for customer acquisition, brand experience, online order fulfillment, returns and data gathering.
E-tailers, such as Amazon, are going one step further by adopting the ‘clicks-and-bricks’ trend, where previously online-only entities are opening physical stores – highlighting the need for an on-the-ground presence.
This makes sense, as a study conducted in Europe by Ipsos found 70% of consumers prefer to buy online with retailers who have a brick and mortar presence.
Experiential shopping
As shoppers are now able to buy almost any product, anywhere, shopping centres and malls, as well as brick and mortar retailers must therefore fulfil consumers’ desire for entertainment and experience, rather than the traditional procedure of purchasing and owning things.
Globally, leasing in malls and shopping centres will be dominated by food and beverage, cosmetics, lifestyle and experience-based offerings. Landlords of midmarket, mid-tier centres are repositioning to attract these types of tenants.
In the US, this is particularly easy given the sheer volume of vacancies caused by store closures. On the other side of the International Date Line, experiential factors remain a focus for APAC shopping centres, but a trend in co-working spaces in centre locations is also gaining prominence.
Another strategy is to seek operators that cater to the growing health and fitness-conscious consumer. This may include leasing space to a gym or fitness centre, as well as seeking health-focused food and beverage tenants, or even food and produce markets.
In APAC alone, growing consumer demand for experiential shopping is expected to see experience-based spending total US$825 billion between 2018 and 2030. Centres with established experiential retail models are proof of how successful they can be.
There is no shortage of opportunity for those who know where to look. Moving forward, in an almost oxymoronic way, retail will likely form a smaller part of the tenant mix, as non-retail facilities such as restaurants, childcare facilities, fitness and services become standard in many locations.
Traditional retail is therefore being resized, reinvented and reimagined. This is leading to retailer restructuring and shrinking store networks and the disruption is creating the inevitable opportunities for new operators and formats to emerge.

Research and Insights
June 24, 2019
Retirement living state of play and outlook
Jack Green
Australia’s birth rate between 1946 and 1964 increased substantially, fuelling a significant structural shift in Australia’s demographic make-up. Labelled ‘baby boomers’, and currently aged between 55 and 73 years of age, this generation is today shaping the way retirement accommodation is provided to older Australians.
Living longer
Medical, economic and societal advances are allowing people to drastically outlive even relatively recent life expectancy estimates. If you are currently 65 years of age, your life expectancy when you were born was around 68 for males and 74 for females.
However, before you panic, there’s good news. Resulting from the aforementioned advances, as a 65-year-old, you are now, on average, expected to live another 19.5 years if you are a male, and 22.3 years if you are a female1.
As of 2017, there were 3.8 million Australians aged 65 or above, which comprised 15% of the total population. For reference, this figure was just 1.3 million (9%) in 1977 and is anticipated to be 8.8 million (22%) by 20572. This growth is expected to drive a large increase in retirement and aged care demand, and highlights the opportunity to both existing operators and new market entrants.
Retirement living and aged care: What’s the difference?
Retirement living
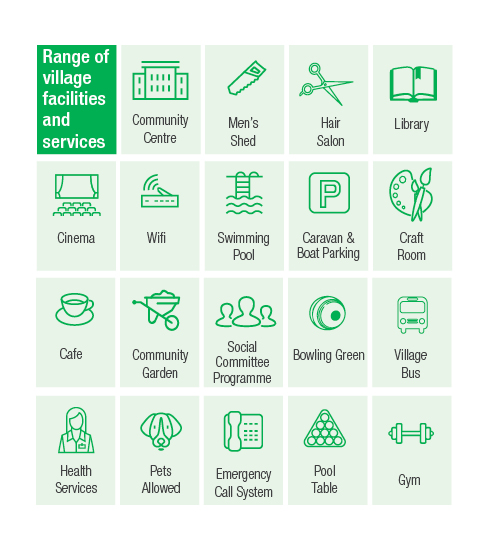
Defined as a residential dwelling and lifestyle complex, generally for independent and self-funded retirees over the age of 55, retirement living villages are made up of private homes, called Independent Living Units or ILU’s, and usually offer a range of shared facilities, such as community centres, pools, gyms and sports facilities.
According to the most recently available data, there were just over 170,000 ILUs in 2016, housing over 220,000 people. As baby boomers start to retire, it is anticipated that by 2036, the market will have approximately doubled in size1.
However, there is an increasing disparity between actual supply and this demand. The November 2018 PwC/Property Council Retirement Census, which saw contributions from 52 retirement living operators representing over 610 villages showed only 2,000 new ILUs are set to hit the market each year across the next four years. This current rate of supply is, on average, less than one quarter of what is required.
Aged care
Unlike the retirement living sector, where additional healthcare and support is not the primary service driver, the aged care sector provides fulltime care to individuals requiring supervision and assistance.
As per the most recent statistics at June 2016, there were just under 200,000 residential aged care beds operational in Australia. Between 2009 and 2016, only 21,000 new places became operational, even though population growth amongst the 70-plus age cohort was 23%3.
It is estimated that by 2026, an additional 87,000 places will be required nationally in order to meet demand. This challenge will be heightened by any recommendations that may arise from the Aged Care Royal Commission.
Periodic reviews of the aged care industry have centred on whether the community can have confidence in the quality of the care being provided, and the effectiveness of the regulatory framework.
All previous reviews unanimously concluded that the aged care system is in need of reform, and it’s anticipated the current Royal Commission will do the same. The system is complex and fragmented, and history demonstrates reform has been exceedingly difficult to implement.
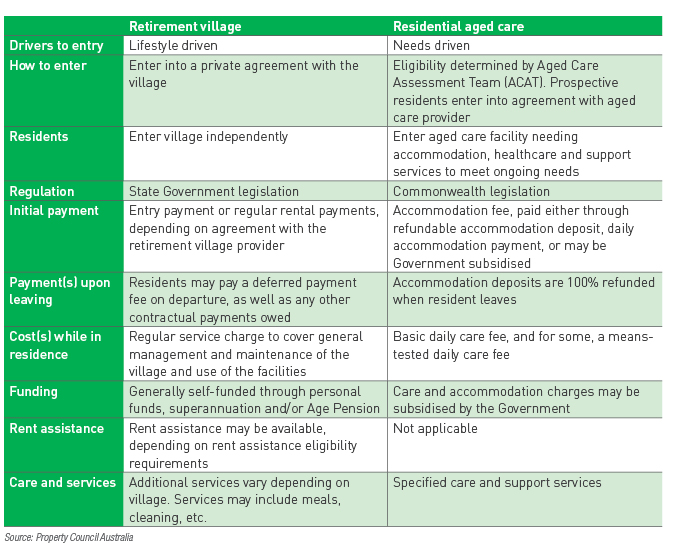
The table below highlights a number of key differences between retirement villages and residential aged care in Australia.